

Clover Health Reports Third Quarter 2021 Financial Results
Total revenue was
Lives under Clover Management increased 125% year-over-year
GAAP Medicare Advantage (MA) Medical Care Ratio (MCR) improved by 850 basis points compared to the prior quarter
MA PPO plan focused on underserved communities and offering a wide provider network was awarded 3.5 Stars
Clover provides preliminary 2022 MA guidance: Average MA Lives of 82,000, up 20% plus year-over-year, and MA MCR in the range of 95% to 99%

"Our mission is to improve every life; we do so by providing access to care across a wide, open network, which is supported and enabled by our technology platform, the Clover Assistant. We serve a broader variety of communities than is typical in MA - approximately 66% of our members live in communities in the top half of the area deprivation index and approximately 49% of our members who self-identify are minorities - and we are proud that we have been identified as a high-performing MA plan based on a prototype of the Health Equity Summary Score," said
Management Commentary on Financial Highlights
"Clover continues to scale with a current annual revenue run rate of
| Dollars in Millions | Q3’21 | Q3’20 | ||||||
| Total Revenue | $ | 427.2 | $ | 169.1 | ||||
| GAAP Medicare Advantage (MA) Medical Care Ratio (MCR) | 102.5 | % | 86.7 | % | ||||
| Normalized MA MCR (Non-GAAP) (1) | 94.8 | 96.4 | ||||||
| Salaries and benefits plus General and administrative expenses | $ | 119.1 | $ | 46.5 | ||||
| Adjusted Operating Expenses (Non-GAAP) (1) | 72.3 | 45.0 | ||||||
| Net (Loss) Income | (34.5 | ) | 12.8 | |||||
| Adjusted EBITDA (Non-GAAP) (1) | (102.3 | ) | (20.0 | ) | ||||
| Normalized Adjusted EBITDA (Non-GAAP) (1) | (61.1 | ) | (36.8 | ) | ||||
(1) Reconciliations of Normalized MA MCR (Non-GAAP) to GAAP MA MCR, Adjusted Operating Expenses (Non-GAAP) to the sum of Salaries and benefits plus General and administrative expenses, Adjusted EBITDA (Non-GAAP) to Net Income (Loss), and Normalized Adjusted EBITDA (Non-GAAP) to Net Income (Loss), respectively, are provided in the tables immediately following the consolidated financial statements below. Additional information about the Company's non-GAAP financial measures can be found under the caption "About Non-GAAP Financial Measures" below and in Appendix A.
Third Quarter 2021 Financial Highlights
- Total revenue was
$427 million in the third quarter of 2021, a 153% increase compared to$169 million in the third quarter of 2020. This consisted of$204 million in Medicare Advantage premiums and$223 million inDirect Contracting revenue. - Lives under Clover Management at quarter-end was approximately 129,100, an increase of 125% compared to
September 30, 2020 . Medicare Advantage membership andDirect Contracting lives were 67,281 and 61,818, respectively, as ofSeptember 30, 2021 . - Our GAAP Medicare Advantage MCR for the quarter was 102.5%, compared to 111.0% for second quarter 2021 and 86.7% for third quarter 2020. The year-over-year increase was primarily driven by higher direct expenses for caring for members impacted by COVID-19 and increased utilization from deferred outpatient care, while the sequential decrease was driven largely by operational efficiencies, a decline in direct COVID costs, and seasonal trends. Normalized Medicare Advantage MCR (Non-GAAP), which excludes the estimated net effect of COVID-19 and any changes to our estimate of prior period revenue and medical costs, was 94.8% for the quarter, as compared to 96.3% for second quarter 2021 and 96.4% for third quarter 2020.
- Direct Contracting Margin, which represents the ratio of net medical claims incurred for our
Direct Contracting segment toDirect Contracting revenue, was 102.4% for the quarter, down from 111.8% in the second quarter. Adjusted Direct Contracting Margin (Non-GAAP)(1) was 101.3%. This measure excludes direct COVID-19 expenses and prior period development. We believe that we do not currently have sufficient data or historical claims to calculate a fully "normalized" MCR calculation. We expect the financial performance ofDirect Contracting to improve as a result of a full ramp-up in a number of areas, including clinical initiatives, additional impact from the Clover Assistant, projected declines in direct COVID costs, reductions in pent-up demand, timing of stop-loss recoupments and potential benchmark trend adjustments by theCenters for Medicare and Medicaid Services (CMS). - Salaries and benefits plus General and administrative expenses for the quarter were
$119.1 million , compared to$46.5 million for third quarter 2020, an increase of$72.6 million . The largest component of this increase was non-cash, stock-based compensation expense. - Premium deficiency reserve expense was
$20.8 million for the third quarter, in anticipation of a reserve deemed necessary for the remainder of 2021. This compared to a$0.8 million benefit in third quarter 2020. - GAAP net (loss) income for the quarter was
$(34.5) million , compared to net income of$12.8 million for third quarter 2020. Our third quarter 2021 results reflect a non-cash benefit of$115.2 million relating to the change in the fair value of our public and private placement warrant liabilities. - Adjusted EBITDA loss (Non-GAAP) for the quarter was
$(102.3) million , and Normalized Adjusted EBITDA loss (Non-GAAP), which excludesDirect Contracting gross profit or loss, the estimated impact of the COVID-19 pandemic on our MA results, and certain other items, was$(61.1) million . - Cash, cash equivalents and investments totaled
$588.7 million as ofSeptember 30, 2021 .
(1) A reconciliation of Adjusted Direct Contracting Margin (Non-GAAP) to Direct Contracting Margin is provided in the tables immediately following the consolidated financial statements below. Additional information about the Company’s non-GAAP financial measures can be found under the caption "About Non-GAAP Financial Measures" below and in Appendix A.
Clover Assistant (CA) Highlights
- Lives under Clover Assistant Management grew 223% year-over-year to approximately 94,000 at
September 30, 2021 . Approximately 2,900 NPIs used Clover Assistant in the third quarter, up 45% year-over-year. - MA members who saw a PCP live on Clover Assistant had an MCR that was more than 1,000 basis points lower than for members who didn't during third quarter 2021. Further, our MA members with PCPs who were live on CA in 2019 had a lower MCR than members with PCPs who went live on CA in 2020, and members with PCPs who went live on CA in 2018 had a lower MCR than members who went live on CA in 2019.
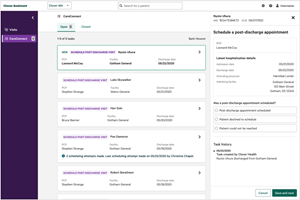
- Clover Assistant visits increased 73% year-over-year in the third quarter. Since inception in 2018, the Clover Assistant has surfaced 1.3 million recommendations to physicians.
- We have recently launched several new feature releases on CA. Highlighted features include:
- Improved PCP workflows through several quality of life improvements;
- Interoperability features enabling CA to integrate with electronic health record systems; and
- PCPs now have easy access to specialist support services for oncology.
The following screenshots provide visual examples of the Clover Assistant interface, with data provided for fictitious patients:
Photos accompanying this announcement are available at:
https://www.globenewswire.com/NewsRoom/AttachmentNg/5d3db006-2871-447f-b6b6-3fab8a0a1420
https://www.globenewswire.com/NewsRoom/AttachmentNg/ca1ed906-b721-4e02-8f85-d313ffd3b471
MA Star Rating
CMS recently upgraded Clover’s PPO plan to 3.5 stars on the Medicare Star Ratings for its Medicare Advantage (MA) plans for the 2020 measurement year. Currently, over 90% of Clover’s MA membership is served through its PPO plan.
We believe that this is a significant event for Clover for several reasons. First, we anticipate the higher Star Rating will positively impact our MA MCR in 2023 by 300 to 500 basis points assuming similar plan design to current offerings, driving meaningful support of profitability. Further, we believe a potential move from 3.5 to 4.0 stars in a future measurement year could have an even larger impact on our MA MCR. Second, the higher Star Rating was achieved on a wide network plan that serves a higher percentage of underserved beneficiaries than is typical in the industry. We believe this is a proof point that our tech-centric approach to Medicare and health equity is working and is applicable across the full Medicare population as opposed to only small, high-performing segments.
Normalized MA MCR (Non-GAAP)
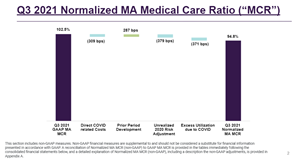
In calculating Normalized MA MCR (Non-GAAP), we subtract or add, as applicable, direct COVID-related costs, including utilization deferred in prior periods, an estimate of the net effect of care deferred or eliminated by the COVID-19 environment, an estimate of other adjustments in the current period which relate to prior period dates of service, and an estimate of the COVID-19 pandemic’s impact on the Company’s premium revenue, which management believes has been impacted by lower risk adjustment scores in 2021 due to reduced utilization and less thorough and accurate documentation of our members’ clinical utilization in 2020 due to the COVID-19 environment. The Normalized MA MCR (Non-GAAP) calculation represents management’s current estimates and assumptions regarding the impacts of the COVID-19 pandemic on the Company’s financial results and remains subject to significant uncertainties, including the ultimate severity, magnitude and duration of the COVID-19 pandemic, including the development of new COVID-19 variants, and the potential for further deferrals of elective or preventive care due to additional COVID-19 outbreaks and stay-at-home orders and the resulting impact on future medical complications, future medical costs and/or a reduction in risk adjustments and benchmarks against which future CMS bids will be assessed. For additional information, see the definition of "Normalized MCR" in Appendix A.
Applying this methodology for calculating our Normalized MA MCR (Non-GAAP), as illustrated in the following chart, in the third quarter, our Normalized MA MCR was 94.8%(1).
A photo accompanying this announcement is available at https://www.globenewswire.com/NewsRoom/AttachmentNg/73c09abb-5332-4129-9ad2-6789a3a7cfaf
(1) This section includes non-GAAP measures. Non-GAAP financial measures are supplemental to and should not be considered a substitute for financial information presented in accordance with GAAP. A reconciliation of Normalized MA MCR (non-GAAP) to GAAP MA MCR is provided in the tables immediately following the consolidated financial statements below, and a detailed explanation of Normalized MA MCR (non-GAAP), including a description the non-GAAP adjustments, is provided in Appendix A.
Management Long-Term View
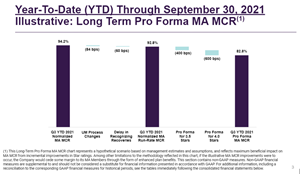
Management continues to believe there is a long-term opportunity to improve our Normalized MA MCR (Non-GAAP), driven by potential improvements in internal processes, including utilization management process changes, expediting recognizing recoveries, and improved Star Ratings. We note that there can be no assurance that we will be able to maintain or improve our Star Ratings beyond the 3.5 Stars recently awarded by CMS to our PPO plan or that the other assumptions we make will be achieved for the reasons discussed in the Risk Factors section of our 2020 Annual Report on Form 10-K and the Risk Factors section of our Quarterly Report on Form 10-Q for the quarter ended
We have attempted to illustrate this potential improvement in Normalized MA MCR (Non-GAAP) in the table below(1).
A photo accompanying this announcement is available at https://www.globenewswire.com/NewsRoom/AttachmentNg/59bc2728-697e-4def-b185-0706305c52cc
(1) This Long-Term Pro Forma MA MCR chart represents a hypothetical scenario based on management estimates and assumptions, and reflects maximum beneficial impact on MA MCR from incremental improvements in Star ratings. Among other limitations to the methodology reflected in this chart, if the illustrative MA MCR improvements were to occur, the Company would cede some margin to its MA Members through the form of enhanced plan benefits. This section contains non-GAAP measures. Non-GAAP financial measures are supplemental to and should not be considered a substitute for financial information presented in accordance with GAAP. For additional information, including a reconciliation to the corresponding GAAP financial measures for historical periods, see the tables immediately following the consolidated financial statements below.
Financial Outlook
For full-year 2021,
- Total revenues are expected to be in the range of
$1.42 billion to$1.47 billion . This includes projected MA revenue of$780 million to$790 million andDirect Contracting revenue of$640 million to$680 million . - Medicare Advantage membership is expected to be in the range of 67,300 - 68,000 by
December 31, 2021 , a growth rate of 16% - 17% as compared to year-end 2020. - For the
Direct Contracting program, the Company expects the number of aligned beneficiaries to remain roughly flat for the remainder of 2021. - Normalized MA MCR (Non-GAAP)(1) is expected to be in the range of 94% - 96%.
- Adjusted Operating Expenses (Non-GAAP)(1), which we define as Salaries and benefits plus General and administrative expenses less stock-based compensation expense, is expected to be between
$270 and$280 million . - Adjusted Operating Expenses as a percentage of revenue (Non-GAAP)(1) is expected to be 17% in fourth quarter 2021, compared to 19% in the first three quarters of 2021 and 22% in full year 2020.
- Normalized Adjusted EBITDA loss (Non-GAAP)(1) is expected to be in the range of (
$250 ) -($230) million .
For full-year 2022,
- Medicare Advantage membership is expected to average 82,000 for the full year, representing an acceleration in year-over-year growth to more than 20%. This includes an expected doubling of lives in
Georgia to a projected 2022 average of approximately 8,500. Direct Contracting lives are expected to grow significantly from current levels, and similar to this year, almost all growth will come through claims alignment. - GAAP MA MCR is expected to be in the range of 95% - 99%. Improvement is expected to be driven by continued clinical program enhancements, increased risk scores and lower COVID-19 costs. Direct Contracting Margin is also expected to improve versus 2021 levels. This guidance assumes current COVID-19 trends continue, and any significant developments related to COVID-19 could impact expectations.
- Adjusted Operating Expenses (Non-GAAP)(1), which we define as Salaries and benefits plus General and administrative expenses less stock-based compensation expense, are expected to grow at a significantly lower rate than in 2021 due to operational efficiencies.
- Clover expects to provide guidance for 2022
Direct Contracting lives and consolidated revenue at a later date after expectedDirect Contracting lives are finalized..
(1) A reconciliation of projected Normalized MA MCR (Non-GAAP) to projected GAAP MA MCR is not provided because COVID-related costs, which are excluded from Normalized MA MCR (Non-GAAP), cannot be reasonably calculated or predicted at this time without unreasonable efforts. Reconciliations of projected Adjusted Operating Expenses (Non-GAAP) to projected Salaries and benefits plus General and administrative expenses, and of projected Adjusted Operating Expenses as a Percentage of Revenue (Non-GAAP) to projected Salaries and Benefits plus General and administrative expenses, are not provided because stock-based compensation expense, which is excluded from Adjusted Operating Expenses (Non-GAAP), cannot be reasonably calculated or predicted at this time without unreasonable efforts. A reconciliation of projected Normalized Adjusted EBITDA (Non-GAAP) to net loss is not provided because certain items that are excluded from Normalized Adjusted EBITDA (Non-GAAP), including changes in the fair value of the Company’s warrant liability, stock-based compensation expense, and COVID-related costs related to our MA operations, cannot be reasonably calculated or predicted at this time without unreasonable efforts. Additional information about the Company's non-GAAP financial measures can be found under the caption "About Non-GAAP Financial Measures" below and in Appendix A.
Earnings Conference Call Details
Clover Health’s management will host a conference call to discuss its financial results on
Forward-Looking Statements
This press release contains forward-looking statements within the meaning of Section 27A of the Securities Act of 1933, as amended, and Section 21E of the Securities Exchange Act of 1934, as amended. Forward-looking statements include statements regarding future events and Clover Health’s future results of operations, financial position, market size and opportunity, business strategy and plans, and the factors affecting our performance and our objectives for future operations. In some cases, you can identify forward looking statements because they contain words such as "may," "will," "should," "expects," "plans," "anticipates," "going to," "can," "could," "should," "would," "intends," "target," "projects," "contemplates," "believes," "estimates," "predicts," "potential," "outlook," "forecast," "objective," "plan," "seek," "grow," "target," "if," "continue," or the negative of these words or other similar terms or expressions that concern Clover Health’s expectations, strategy, priorities, plans or intentions. Forward-looking statements in this release include, but are not limited to, statements under "Financial Outlook," including expectations relating to Medicare Advantage membership growth, projected levels of
About Non-GAAP Financial Measures
We use non-GAAP measures including Adjusted Direct Contracting Margin, Adjusted EBITDA, Adjusted Operating Expenses, Adjusted Operating Expenses as a percentage of revenue, Normalized Adjusted EBITDA, and Normalized MA MCR. These non-GAAP financial measures are provided to enhance the reader’s understanding of Clover Health’s past financial performance and our prospects for the future. Clover Health’s management team uses these non-GAAP financial measures in assessing Clover Health’s performance, as well as in planning and forecasting future periods. These non-GAAP financial measures are not computed according to GAAP, and the methods we use to compute them may differ from the methods used by other companies. Non-GAAP financial measures are supplemental to, should not be considered a substitute for financial information presented in accordance with GAAP and should be read only in conjunction with our consolidated financial statements prepared in accordance with GAAP. Readers are encouraged to review the reconciliations of these non-GAAP financial measures to the comparable GAAP measures, which are attached to our quarterly earnings release and which can be found, along with other financial information including our filings with the
For a description of these non-GAAP financial measures, including the reasons management uses each measure, please see Appendix A: "Explanation of Non-GAAP Financial Measures and Other Items."
The statements contained in this document are solely those of the authors and do not necessarily reflect the views or policies of CMS. The authors assume responsibility for the accuracy and completeness of the information contained in this document.
About
We aim to provide great care, in a sustainable way, by having a business model built around improving medical outcomes while lowering avoidable costs. We do this while taking a holistic approach to understanding the health needs and social risk factors of those under our care. This strategy is underpinned by the company’s proprietary software platform, the Clover Assistant, which is designed to aggregate patient data from across the health ecosystem to support clinical decision-making by providing physicians with real-time, personalized recommendations at the point of care.
Making care more accessible is at the heart of our business, and we believe patients should have the freedom to choose their doctors. We offer two models of care: affordable Medicare Advantage plans with extensive benefits; and care coordination for Original Medicare beneficiaries through
With its corporate headquarters in
Contacts:
Investor Relations:
Press Contact:
Andrew Still-Baxter
[email protected]
CONSOLIDATED BALANCE SHEETS: SELECTED METRICS
(in thousands)
2021 (Unaudited) |
2020 |
||||||
| Selected Balance Sheet Data: | |||||||
| Cash, cash equivalents and investments | $ | 588,674 | $ | 151,103 | |||
| Total assets | 952,478 | 267,252 | |||||
| Unpaid claims | 140,210 | 103,976 | |||||
| Notes and securities payable, net of discount and deferred issuance costs | 19,929 | 106,413 | |||||
| Warrants payable | — | 97,782 | |||||
| Total liabilities | 540,188 | 432,698 | |||||
| Convertible Preferred stock | — | 447,747 | |||||
| Total stockholders' equity (deficit) | 412,290 | (613,193 | ) | ||||
| CONSOLIDATED STATEMENTS OF OPERATIONS | |||||||||||||||
| (in thousands) (Unaudited) | |||||||||||||||
| Three Months Ended |
Nine Months Ended |
||||||||||||||
| 2021 | 2020 | 2021 | 2020 | ||||||||||||
| Revenues: | |||||||||||||||
| Premiums earned, net (Net of ceded premiums of |
$ | 203,657 | $ | 167,075 | $ | 598,390 | $ | 501,100 | |||||||
| 222,647 | — | 439,020 | — | ||||||||||||
| Other income | 859 | 1,994 | 2,550 | 5,555 | |||||||||||
| Total revenues | 427,163 | 169,069 | 1,039,960 | 506,655 | |||||||||||
| Operating expenses: | |||||||||||||||
| Net medical claims incurred | 436,422 | 144,846 | 1,109,375 | 410,540 | |||||||||||
| Salaries and benefits | 73,364 | 16,628 | 201,555 | 57,339 | |||||||||||
| General and administrative expenses | 45,749 | 29,847 | 129,983 | 79,798 | |||||||||||
| Premium deficiency reserve expense (benefit) | 20,761 | (772 | ) | 48,661 | (16,357 | ) | |||||||||
| Depreciation and amortization | 120 | 138 | 398 | 413 | |||||||||||
| Other expense | — | — | 191 | — | |||||||||||
| Total operating expenses | 576,416 | 190,687 | 1,490,163 | 531,733 | |||||||||||
| Loss from operations | (149,253 | ) | (21,618 | ) | (450,203 | ) | (25,078 | ) | |||||||
| Change in fair value of warrants payable | (115,152 | ) | 20,029 | (66,146 | ) | 31,903 | |||||||||
| Interest expense | 413 | 9,268 | 2,817 | 25,560 | |||||||||||
| Amortization of notes and securities discounts | 13 | 4,408 | 13,681 | 14,935 | |||||||||||
| Gain on derivative | — | (68,081 | ) | — | (87,475 | ) | |||||||||
| Net (loss) income | $ | (34,527 | ) | $ | 12,758 | $ | (400,555 | ) | $ | (10,001 | ) | ||||
| RECONCILIATION OF NON-GAAP FINANCIAL MEASURES | |||||||
| ADJUSTED EBITDA AND NORMALIZED ADJUSTED EBITDA RECONCILIATION | |||||||
| (in thousands) (Unaudited)(1) | |||||||
| Three Months Ended |
|||||||
| 2021 | 2020 | ||||||
| Net (loss) income: | $ | (34,527 | ) | $ | 12,758 | ||
| Adjustments | |||||||
| Interest expense | 413 | 9,268 | |||||
| Amortization of notes and securities discount | 13 | 4,408 | |||||
| Depreciation and amortization | 120 | 138 | |||||
| Change in fair value of warrants payable | (115,152 | ) | 20,029 | ||||
| Gain on derivative | — | (68,081 | ) | ||||
| Stock-based compensation expense | 46,803 | 1,500 | |||||
| Adjusted EBITDA (Non-GAAP) | $ | (102,330 | ) | $ | (19,980 | ) | |
| Normalization adjustments | |||||||
| MA direct COVID related costs | $ | 6,012 | $ | 3,783 | |||
| MA prior period development | (5,837 | ) | (8,104 | ) | |||
| MA unrealized 2020 risk adjustment | 7,682 | — | |||||
| MA excess (reduced) utilization due to COVID | 7,217 | (11,708 | ) | ||||
| Premium deficiency reserve expense (benefit) | 20,761 | (772 | ) | ||||
| 5,413 | — | ||||||
| Normalized adjusted EBITDA (Non-GAAP) | $ | (61,082 | ) | $ | (36,781 | ) | |
(1) This section includes non-GAAP measures. Non-GAAP financial measures are supplemental to and should not be considered a substitute for financial information presented in accordance with GAAP. For a detailed explanation of these non-GAAP measures, see Appendix A.
RECONCILIATION OF NON-GAAP FINANCIAL MEASURES
NORMALIZED MA MCR (NON-GAAP) RECONCILIATION
(Unaudited)(1)
| Three Months Ended |
|||||
| 2021 | 2020 | ||||
| GAAP MA MCR: | 102.5 | % | 86.7 | % | |
| Adjustments | |||||
| Direct COVID related costs | (3.1 | ) | (2.3 | ) | |
| Prior period development | 2.9 | 5.0 | |||
| Unrealized 2020 risk adjustment | (3.8 | ) | — | ||
| (Reduced) excess utilization due to COVID | (3.7 | ) | 7.0 | ||
| Normalized MA MCR (Non-GAAP) | 94.8 | % | 96.4 | % | |
(1) This section includes non-GAAP measures. Non-GAAP financial measures are supplemental to and should not be considered a substitute for financial information presented in accordance with GAAP. For a detailed explanation of these non-GAAP measures, see Appendix A.
RECONCILIATION OF NON-GAAP FINANCIAL MEASURES
NORMALIZED MA MCR (NON-GAAP) RECONCILIATION
(Unaudited)(1)
| Nine Months Ended |
||
| GAAP MA MCR: | 107.1 | % |
| Adjustments | ||
| Direct COVID related costs | (7.3 | ) |
| Prior period development | (1.6 | ) |
| Unrealized 2020 risk adjustment | (3.8 | ) |
| Excess (reduced) utilization due to COVID | (0.2 | ) |
| Normalized MA MCR (Non-GAAP) | 94.2 | % |
(1) This section includes non-GAAP measures. Non-GAAP financial measures are supplemental to and should not be considered a substitute for financial information presented in accordance with GAAP. For a detailed explanation of these non-GAAP measures, see Appendix A.
RECONCILIATION OF NON-GAAP FINANCIAL MEASURES
ADJUSTED DIRECT CONTRACTING MARGIN (NON-GAAP) RECONCILIATION
(Unaudited)(1)
| Three Months Ended |
|||
| $ | 222,647 | ||
| 228,060 | |||
| Direct Contracting Margin | 102.4 | % | |
| 102.4 | % | ||
| Adjustments | |||
| Direct COVID related costs | (3.4 | ) | |
| Prior period development | 2.3 | ||
| Adjusted Direct Contracting Margin (Non-GAAP) | 101.3 | % | |
(1) This section includes non-GAAP measures. Non-GAAP financial measures are supplemental to and should not be considered a substitute for financial information presented in accordance with GAAP. For a detailed explanation of these non-GAAP measures, see Appendix A.
RECONCILIATION OF NON-GAAP FINANCIAL MEASURES
ADJUSTED OPERATING EXPENSES (NON-GAAP) RECONCILIATION
(in thousands) (Unaudited)(1)
| Three Months Ended |
|||||||
| 2021 | 2020 | ||||||
| Salaries and benefits | $ | 73,364 | $ | 16,628 | |||
| General and administrative expenses | 45,749 | 29,847 | |||||
| Total Salaries and benefits plus General and administrative expenses | 119,113 | 46,475 | |||||
| Adjustments | |||||||
| Stock-based compensation expense | (46,803 | ) | (1,500 | ) | |||
| Adjusted Operating Expenses (Non-GAAP) | $ | 72,310 | $ | 44,975 | |||
| Total revenues | $ | 427,163 | 169,069 | ||||
| Adjusted Operating Expenses (Non-GAAP) as a Percentage of Revenue | 17 | % | 27 | % | |||
(1) This section includes non-GAAP measures. Non-GAAP financial measures are supplemental to and should not be considered a substitute for financial information presented in accordance with GAAP. For a detailed explanation of these non-GAAP measures, see Appendix A.
Appendix A
Explanation of Non-GAAP Financial Measures and Other Items
Non-GAAP Adjustments
We believe it is useful to investors for our presentation within this document on a non-GAAP basis to exclude the below items. In particular, we believe that the exclusion of these amounts provides useful measures for period-to-period comparisons of our business. These key measures are used by our management and the board of directors to understand and evaluate our operating performance and trends, to prepare and approve our annual budget and to develop short and long-term operating plans.
Amortization of notes and securities discount - We report non-convertible notes and convertible securities at carrying value, net of discount. We account for convertible securities in accordance with accounting guidance for debt with conversion and other options, after determining whether embedded conversion options should be bifurcated from their host instruments.
Change in fair value of warrants payable - The fair value of warrant liabilities is estimated using a valuation method based on the level of instrument, where the values of various instruments are estimated based on an analysis of future values, assuming various future outcomes.
Depreciation and Amortization - Depreciation and amortization consists of all depreciation and amortization expenses associated with our property and equipment. Depreciation includes expenses associated with property and equipment. Amortization includes expenses associated with leasehold improvements.
Delay in Recognizing Recoveries – As a result of implementation delays, we have been unable to accrue for the full amount of expected recoveries related to improper claims payments. We believe that we will ultimately recover these payments and have excluded the impact of the delay from our calculation of the Illustrative Long-Term Pro Forma MA MCR (Non-GAAP) provided on page 6.
Direct COVID-Related Costs – This consists of our estimate of costs associated with COVID-19 related care and testing.
Excess (Reduced) Utilization due to COVID – This consists of (1) our estimate of non-COVID-19 related services that were deferred in prior periods and ultimately realized in the current period, and (2) our estimate of utilization related to conditions that were exacerbated by a lack of diagnoses and treatment in prior periods due to the pandemic, for which we have incurred higher cost of treatment in the current period.
Gain on Derivative - This consists of values determined after we have evaluated the embedded features of our convertible securities by applying derivative accounting guidance. Derivatives embedded within non-derivative instruments, such as convertible securities, are bifurcated from the host instrument when the embedded derivative is not clearly and closely related to the host instrument.
Interest Expense - Interest expense consists mostly of interest expense associated with previously outstanding non-convertible notes under our term loan facility that was terminated in the second quarter of 2021.
Premium deficiency reserve expense (benefit) – This consists of a reserve established to the extent that the sum of expected future costs, claim adjustment expenses, and maintenance costs exceeds related future premiums under contracts without consideration of investment income. We assess the profitability of our contracts with CMS to identify those contracts where current operating results or forecasts indicate probable future losses. Premium deficiency reserve expense (benefit) is recognized in the period in which the losses are identified.
Prior
Pro Forma for Stars Adjustment – This consists of our estimate of the impact to GAAP MCR for higher Star plan rating. Currently, Clover’s MA plans have a 3 Star plan rating, and its MA PPO plan was recently awarded 3.5 stars for the 2020 measurement year. In the Illustrative Long-Term Pro Forma MA MCR (Non-GAAP) provided on page 6, we have presented the pro forma impact of potential higher ratings for illustrative purposes and note that Clover may choose to use incremental revenue related to Stars improvement to drive more benefits for members.
Stock-Based Compensation Expense - This consists of expenses for stock-based payment awards granted to employees and non-employees.
UM (Utilization Management) Process Changes – This consists of our estimate of the impact of process deterioration in our utilization management program during 2021. The issues that caused the deterioration have been identified and resolved. Therefore, we have excluded the impact of the process deterioration from our Illustrative Long-Term Pro Forma MA MCR (Non-GAAP) provided on page 6.
Unrealized 2020 Risk Adjustment – This consists of our estimate of COVID-19’s impact on member risk scores in 2021. Reduced utilization in 2020 due to COVID-19 resulted in fewer diagnoses being made and fewer chronic conditions being treated, which had a negative impact on member risk scores and premium revenue in 2021.
Non-GAAP Definitions
Adjusted EBITDA - A non-GAAP financial measure defined by us as net loss before interest expense, amortization of notes and securities discount, depreciation and amortization, change in fair value of warrants payable, (gain) loss on derivative, and stock-based compensation expense. Adjusted EBITDA is a key measure used by our management team and the board of directors to understand and evaluate our operating performance and trends, to prepare and approve our annual budget and to develop short and long-term operating plans. In particular, we believe that the exclusion of the amounts eliminated in calculating Adjusted EBITDA can provide useful measures for period-to-period comparisons of our business. Accordingly, we believe that Adjusted EBITDA provides investors and others useful information to understand and evaluate our operating results in the same manner as our management and our board of directors.
Adjusted Operating Expenses - A non-GAAP financial measure defined by us as Salaries and benefits plus General and administrative expenses less Stock-based compensation expense. We believe that Adjusted Operating Expenses provides management, investors and others a useful view of our operating spend as it excludes non-cash, stock-based compensation. We believe that Adjusted Operating Expenses as a Percentage of Revenue is useful to management, investors, and others because it allows us to measure our operational leverage as revenue scales.
Adjusted Direct Contracting Margin - A non-GAAP financial measure that excludes from Direct Contracting Margin (as defined below) direct COVID-related costs and prior period development. We believe that this metric, which is used by our management team in the operation of the business, is helpful to investors and others in assessing the Company’s financial performance and operations without the temporary distortion caused by the COVID-19 pandemic.
Normalized Adjusted EBITDA - A non-GAAP financial measure defined by us as net loss before interest expense, amortization of notes and securities discount, depreciation and amortization, change in fair value of warrants payable, (gain) loss on derivative, stock-based compensation expense, premium deficiency reserve expense or benefit,
Normalized MA MCR - A non-GAAP financial measure that excludes from MA MCR (as defined below) the impact of COVID-19 on medical costs and premium revenue and adjusts for the estimate of prior period divergence from estimates. The impact of COVID-19 on medical costs consists of direct COVID-related costs, prior period development, unrealized 2020 risk adjustment, and Excess (reduced) utilization due to COVID, and the impact on premium revenue consists of estimates of COVID-19’s impact on member risk scores. We believe that this metric, which is used by our management team in the operation of the business, is helpful to investors and others in assessing the Company’s financial performance and operations without the temporary distortion caused by the COVID-19 pandemic.
Definitions of Other Items
Direct Contracting Margin - We calculate our Direct Contracting Margin by dividing net medical claims incurred in connection with our
Lives under Clover Assistant Management - Medicare Advantage members and Original Medicare beneficiaries attributed to CA physicians or practices live on the Clover Assistant on or before
Lives under Clover Management - Consists of our (i) Medicare Advantage members and (ii) Original Medicare beneficiaries aligned to the Company’s Direct Contracting Entity (DCE) via attribution to a DCE-participating provider through alignment based on claims data or by beneficiary election through voluntarily alignment, in connection with the Centers for Medicare & Medicaid Services’ Global and Professional Direct Contracting Model. We believe that Lives under Clover Management is a useful measure of the size of the beneficiary population managed by the Company.
MA Medical Care Ratio, Gross and Net - We calculate our MA medical care ratio (MCR) by dividing total net medical claims incurred by premiums earned, in each case on a gross or net basis, as the case may be, in a given period. We believe our MCR is an indicator of our gross profit for our Medicare Advantage plans and the ability of our Clover Assistant platform to capture and analyze data over time to generate actionable insights for returning members to improve care and reduce medical expenses.



Clover Assistant Interface Screenshot
Clover Assistant Interface Screenshot
Clover Assistant Interface Screenshot

Clover Assistant Interface Screenshot
Q3 2021 Normalized MA Medical Care Ratio ("MCR")
Q3 2021 Normalized MA Medical Care Ratio ("MCR")
Year-To-Date (YTD) Through September 30, 2021 Illustrative: Long Term Pro Forma MA MCR
Year-To-Date (YTD) Through September 30, 2021 Illustrative: Long Term Pro Forma MA MCR
Source:


HERITAGE INSURANCE HOLDINGS, INC. – 10-Q – Management's Discussion and Analysis of Financial Condition and Results of Operations
GoHealth to Present at William Blair 10th Annual Benefit Technology Virtual Conference
Advisor News
- The conversation almost no advisor is having yet
- Why advisors should offer retirement-longevity planning
- A hybrid approach outperforms the 4% Rule, researchers find
- The missing piece in most retirement plans
- Clients are bringing TikTok insurance advice into advisor meetings
More Advisor NewsAnnuity News
- Industry pushes back on linking ‘financial strength’ to annuity illustrations
- Sammons Enterprises & Sammons Financial Group Respond to Reports
- The Manhattan Life Insurance Company Acquires Union Security Life Insurance Company of New York
- Cayman Islands premier to meet with U.S. reinsurance regulators
- Investigation finds deceptive sales, churning of annuities targeting postal workers
More Annuity NewsHealth/Employee Benefits News
Life Insurance News
- U-Haul Holding Company Announces Twentieth Annual Virtual Analyst and Investor Meeting
- Securian Financial Increases Individual Life Retention to $10 Million, Strengthening Support for High-Net-Worth Life Insurance Market
- Americans without children are less confident about retirement, Allianz finds
- The conversation almost no advisor is having yet
- DELAWARE INSURANCE DEPARTMENT DETAILS REVIEW OF BRIGHTHOUSE ACQUISITION
More Life Insurance News