
S&P 500 Buybacks Set A Record High
Historical data on S&P 500 buybacks are available at www.spdji.com/indices/equity/sp-500.
Key Takeaways:
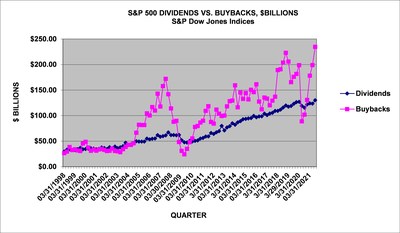
- Q3 2021 share repurchases were
$234.6 billion , increasing 18.0% from Q2 2021's$198.8 billion expenditure and up 130.5% from Q3 2020'$101.8 billion . - 309 companies reported buybacks of at least
$5 million for the quarter, up from 294 in Q2 2021, and up from 190 in Q3 2020; 371 issues did some buybacks for the quarter, up from 360 in Q2 2020 and up from 290 in Q3 2020. - Buybacks remained top heavy with the top 20 issues accounting for 53.8% of Q3 2021 buybacks, down from Q2 2021's 55.7%, down from the dominating 77.4% in Q3 2020, and up from the pre-COVID historical average of 44.5%.
- For the 12-month
September 2021 period, buybacks were$742.2 billion , a 21.8% increase from$609.4 billion in the 12-monthJune 2021 period, and up 30.0% from$570.8 billion in the 12-monthSeptember 2020 period. - Buybacks are expected to continue at a higher level for Q4 2021 as companies continue to cover employee options with discretionary purchases resulting in an increase in share count reduction.
- 7.4% of companies reduced share counts used for EPS by at least 4% year-over-year, up from Q2 2021's 5.4%, and down from Q3 2020's 9.6% period, and significantly down from Q3 2019's 22.8% rate.
- S&P 500 Q3 2021 dividends increased 5.4% to a record
$130.0 billion from Q2 2021's$123.4 billion and were 12.5% greater than the$115.5 billion in Q3 2020. For the 12-monthSeptember 2021 period, dividends were$498.9 billion , up 2.3% on an aggregate basis from the 12-monthSeptember 2020 period's$487.9 billion . - Total shareholder return of buybacks and dividends was a record
$364.7 billion in Q3 2021, up 13.2% from Q2 2021's$322.2 billion and up 67.8% from Q3 2020's$217.3 billion . - Total shareholder return for the 12-month
September 2021 period increased to$1.24 trillion from June 2021's$1.09 trillion and September 2020's$1.06 trillion .
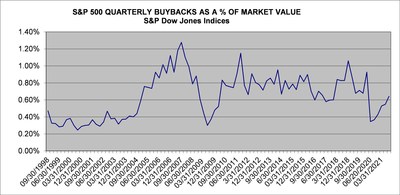
"While companies bought back shares in record numbers in Q3 2021, their expenditures appear cautious when measured against their earnings and market value," said
Remainder of 2021 Outlook, and into 2022:
Silverblatt added, "Companies are expected to increase expenditures, which is needed for the higher priced shares, but not enough to impact share count. Q4 2021 is expected to surpass the Q3 2021

Q3 2021 GICS® Sector Analysis:
Information Technology continued to lead in buybacks, as Financials continue to gain (prior to COVID they were within 1% of each other). In Q3 2021, IT's share declined to 28.2% of all S&P 500 buybacks compared to Q2 2021's 31.6%, and was down from Q3 2020's 48.9%, as expenditures increased (5.3%) to
Financial buybacks increased 48.2%, spending
Consumer Staples decrease their buyback expenditures, down 8.9% to
Consumer Staples decrease their buyback expenditures, down 6.5% to
Issues:
The five issues with the highest total buybacks for Q3 2021 are:
Apple (AAPL) continued to be the poster child for buybacks as it again spent the most of any issue, with the Q3 2021 expenditure ranked eighth highest in S&P history. For the quarter, the company spent$20.5 billion , down 20.1% from Q2 2021's$25.6 billion .Apple holds 17 of the top 20 record quarters (QUALCOM holds #6, T-Mobile holds #18 and International Business Machines holds #20). For the 12-month period,Apple spent$92.5 billion on buybacks, up from the prior period's$76.0 billion . Over the five-year period, they have spent$348.3 billion and$487.6 billion over the ten-year period.- Alphabet (GOOG/L) was next:
$15.0 billion for Q3 2021, up from$8.4 billion in Q2 2021; the 12-monthSeptember 2021 expenditure was$31.5 billion versus$8.7 billion for the 12-months endingSeptember 2020 . Meta Platforms , formerlyFacebook (FB):$12.6 billion for Q3 2021, down from$12.8 billion in Q2 2021; the 12-month expenditure was$44.7 billion versus$29.3 billion .- Oracle (ORCL):
$9.9 billion for Q3 2021, up from$4.2 billion in Q2 2021; the 12-month expenditure was$17.9 billion versus$14.5 billion . Microsoft (MSFT):$8.8 billion for Q3 2021, up from$8.0 billion in Q2 2021; the 12-month expenditure was$25.0 billion versus$19.8 billion .
For more information about
|
|
||||||||
|
S&P 500, $ |
(preliminary in bold) |
|||||||
|
PERIOD |
MARKET |
OPERATING |
AS REPORTED |
DIVIDEND & |
||||
|
VALUE |
EARNINGS |
EARNINGS |
DIVIDENDS |
BUYBACKS |
DIVIDEND |
BUYBACK |
BUYBACK |
|
|
$ BILLIONS |
$ BILLIONS |
$ BILLIONS |
$ BILLIONS |
$ BILLIONS |
YIELD |
YIELD |
YIELD |
|
|
12 Mo Sep,21 |
|
|
|
|
|
1.37% |
2.03% |
3.40% |
|
12 Mo Sep,20 |
|
|
|
|
|
1.75% |
2.05% |
3.80% |
|
2020 |
|
|
|
|
|
1.53% |
1.64% |
3.17% |
|
2019 |
|
|
|
|
|
1.81% |
2.72% |
4.54% |
|
2018 |
|
|
|
|
|
2.17% |
3.84% |
6.01% |
|
|
|
|
|
|
|
1.37% |
2.03% |
3.40% |
|
|
|
|
|
|
|
1.33% |
1.68% |
3.01% |
|
|
|
|
|
|
|
1.43% |
1.48% |
2.91% |
|
|
|
|
|
|
|
1.53% |
1.64% |
3.17% |
|
|
|
|
|
|
|
1.75% |
2.05% |
3.80% |
|
|
|
|
|
|
|
1.93% |
2.52% |
4.45% |
|
|
|
|
|
|
|
2.31% |
3.37% |
5.68% |
|
|
|
|
|
|
|
1.81% |
2.72% |
4.54% |
|
|
|
|
|
|
|
1.94% |
3.12% |
5.06% |
|
|
|
|
|
|
|
1.93% |
3.27% |
5.20% |
|
|
|
|
|
|
|
1.97% |
3.49% |
5.45% |
|
|
|
|
|
|
|
2.17% |
3.84% |
6.01% |
|
|
|
|
|
|
|
1.81% |
2.93% |
4.75% |
|
|
|
|
|
|
|
1.89% |
2.80% |
4.69% |
|
|
|
|
|
|
|
1.90% |
2.56% |
4.46% |
|
|
|
|
|
|
|
1.84% |
2.28% |
4.12% |
|
|
|
|
|
|
|
1.92% |
2.40% |
4.32% |
|
|
|||||||||
|
S&P 500 SECTOR BUYBACKS |
|||||||||
|
SECTOR $ MILLIONS |
Q3,'21 |
Q2,'21 |
Q3,'20 |
12MoSep,'21 |
12MoSep,'20 |
5-YEARS |
10-YEARS |
Q4,'18 |
Q2,'20 |
|
(high) |
(recent low) |
||||||||
|
Consumer Discretionary |
|
|
|
|
|
|
|
|
|
|
Consumer Staples |
|
|
|
|
|
|
|
|
|
|
Energy |
|
|
|
|
|
|
|
|
|
|
Financials |
|
|
|
|
|
|
|
|
|
|
Healthcare |
|
|
|
|
|
|
|
|
|
|
Industrials |
|
|
|
|
|
|
|
|
|
|
Information Technology |
|
|
|
|
|
|
|
|
|
|
Materials |
|
|
|
|
|
|
|
|
|
|
Real Estate |
|
|
|
|
|
|
|
|
|
|
Communication Services |
|
|
|
|
|
|
|
|
|
|
Utilities |
|
|
|
|
|
|
|
|
|
|
TOTAL |
|
|
|
|
|
|
|
|
|
|
SECTOR BUYBACK MAKEUP % |
Q3,'21 |
Q2,'21 |
Q3,'20 |
12MoSep,'21 |
12MoSep,'20 |
5-YEARS |
10-YEARS |
Q4,'18 |
Q2,'20 |
|
Consumer Discretionary |
8.76% |
9.65% |
3.19% |
8.69% |
6.53% |
10.37% |
12.70% |
11.50% |
1.49% |
|
Consumer Staples |
3.55% |
4.48% |
4.16% |
4.80% |
3.58% |
5.31% |
6.80% |
4.30% |
1.71% |
|
Energy |
1.27% |
0.81% |
0.06% |
0.73% |
1.58% |
2.18% |
3.83% |
3.90% |
0.07% |
|
Financials |
26.39% |
21.01% |
11.89% |
20.57% |
20.55% |
21.07% |
18.34% |
20.47% |
9.41% |
|
Healthcare |
6.89% |
8.93% |
7.42% |
9.34% |
10.36% |
11.89% |
12.58% |
14.05% |
12.07% |
|
Industrials |
7.49% |
7.49% |
3.38% |
7.17% |
6.34% |
8.63% |
10.12% |
10.33% |
2.05% |
|
Information Technology |
28.15% |
31.56% |
48.85% |
32.51% |
34.73% |
31.25% |
28.38% |
27.49% |
41.62% |
|
Materials |
2.24% |
2.33% |
0.77% |
2.23% |
1.51% |
1.82% |
2.20% |
2.63% |
0.21% |
|
Real Estate |
0.12% |
0.02% |
0.40% |
0.20% |
0.44% |
0.41% |
0.24% |
0.66% |
0.23% |
|
Communication Services |
15.01% |
13.71% |
17.01% |
13.59% |
13.76% |
6.77% |
4.50% |
4.29% |
31.07% |
|
Utilities |
0.13% |
0.00% |
2.86% |
0.17% |
0.61% |
0.31% |
0.31% |
0.38% |
0.08% |
|
TOTAL |
100.00% |
100.00% |
100.00% |
100.00% |
100.00% |
100.00% |
100.00% |
100.00% |
100.00% |
|
|
||||||||||
|
S&P 500 20 LARGEST Q3 2021 BUYBACKS, $ MILLIONS |
||||||||||
|
Company |
Ticker |
Sector |
Q3 2021 |
Q2 2021 |
Q3 20220 |
12-Months |
12-Months |
5-Year |
10-Year |
Indicated |
|
Buybacks |
Buybacks |
Buybacks |
Sep,'21 |
Sep,'20 |
Buybacks |
Buybacks |
Dividend |
|||
|
$ Million |
$ Million |
$ Million |
$ Million |
$ Million |
$ Million |
$ Million |
$ Million |
|||
|
|
AAPL |
Information Technology |
|
|
|
|
|
|
|
|
|
Alphabet |
GOOGL |
Communication Services |
|
|
|
|
|
|
|
|
|
|
FB |
Communication Services |
|
|
|
|
|
|
|
|
|
Oracle |
ORCL |
Information Technology |
|
|
|
|
|
|
|
|
|
Microsoft |
MSFT |
Information Technology |
|
|
|
|
|
|
|
|
|
JPMorgan Chase |
JPM |
Financials |
|
|
|
|
|
|
|
|
|
|
BRK.B |
Financials |
|
|
|
|
|
|
|
|
|
Bank of America |
BAC |
Financials |
|
|
|
|
|
|
|
|
|
|
CHTR |
Communication Services |
|
|
|
|
|
|
|
|
|
Union Pacific |
UNP |
Industrials |
|
|
|
|
|
|
|
|
|
Lowe's |
LOW |
Consumer Discretionary |
|
|
|
|
|
|
|
|
|
|
HD |
Consumer Discretionary |
|
|
|
|
|
|
|
|
|
Morgan Stanley |
MS |
Financials |
|
|
|
|
|
|
|
|
|
Procter & Gamble |
PG |
Consumer Staples |
|
|
|
|
|
|
|
|
|
Citigroup |
C |
Financials |
|
|
|
|
|
|
|
|
|
Walmart |
WMT |
Consumer Staples |
|
|
|
|
|
|
|
|
|
|
HCA |
Health Care |
|
|
|
|
|
|
|
|
|
|
V |
Information Technology |
|
|
|
|
|
|
|
|
|
Chubb |
CB |
Financials |
|
|
|
|
|
|
|
|
|
|
MA |
Information Technology |
|
|
|
|
|
|
|
|
|
Top 20 |
|
|
|
|
|
|
|
|
||
|
S&P 500 |
|
|
|
|
|
|
|
|
||
|
Top 20 % of S&P 500 |
53.84% |
52.58% |
56.99% |
52.48% |
45.13% |
39.63% |
30.71% |
17.52% |
||
|
Gross values are not adjusted for float |
||||||||||
|
|
|||
|
S&P 500 Q3 2021 Buyback Report |
|||
|
SECTOR |
DIVIDEND |
BUYBACK |
COMBINED |
|
YIELD |
YIELD |
YIELD |
|
|
Consumer Discretionary |
0.62% |
1.25% |
1.87% |
|
Consumer Staples |
3.18% |
1.58% |
4.76% |
|
Energy |
4.15% |
0.49% |
4.64% |
|
Financials |
1.98% |
3.54% |
5.52% |
|
HealthCare |
1.56% |
1.35% |
2.92% |
|
Industrials |
1.50% |
1.69% |
3.18% |
|
Information Technology |
0.83% |
2.05% |
2.88% |
|
Materials |
1.84% |
1.64% |
3.48% |
|
Real Estate |
2.48% |
0.13% |
2.60% |
|
Communications Services |
1.04% |
3.11% |
4.15% |
|
Utilities |
3.06% |
0.13% |
3.19% |
|
S&P 500 |
1.45% |
1.90% |
3.35% |
|
Uses full values (unadjusted for float) |
|||
|
Dividends based on indicated; buybacks based on the last 12-months ending Q3,'21 |
|||
|
Share Count Changes |
||
|
(Y/Y diluted shares used for EPS) |
>=4% |
<=-4% |
|
Q3 2021 |
10.22% |
7.41% |
|
Q2 2021 |
11.02% |
5.41% |
|
Q1 2021 |
10.40% |
5.80% |
|
Q4 2020 |
9.02% |
6.01% |
|
Q3 2020 |
8.62% |
9.62% |
|
Q2 2020 |
8.60% |
17.80% |
|
Q1 2020 |
8.00% |
19.60% |
|
Q4 2019 |
7.63% |
20.68% |
|
Q3 2019 |
8.62% |
22.85% |
|
Q2 2019 |
7.98% |
24.15% |
|
Q1 2019 |
8.03% |
24.90% |
|
Q4 2018 |
8.45% |
18.71% |
|
Q3 2018 |
6.43% |
17.67% |
ABOUT
View original content to download multimedia:https://www.prnewswire.com/news-releases/sp-500-buybacks-set-a-record-high-301449031.html
SOURCE

Osigu a Health Insurance Claims and e-Prescription SaaS Infrastructure for LatAm announces US$7.5 Million in funding
Privacy Act of 1974; System of Records
Advisor News
- How can more Americans achieve financial independence?
- Savers vs. spenders: How money management attitudes impact financial confidence
- Demonstrating the value of life insurance to Gen Z
- Poor money habits are a dealbreaker in a new relationship
- DC plan sponsors see opportunity in alternatives
More Advisor NewsAnnuity News
- The next growth phase in life/annuities depends on modernization
- CA judge certifies class action in teachers’ lawsuit over in-plan annuity fees
- Globe Life Inc. (NYSE: GL) Records 52-Week High Thursday Morning
- AM Best Managing Director Joins ‘Target Topics’ Podcast to Discuss State of Delegated Underwriting Authority Enterprises Market
- KBRA Assigns Rating to TruSpire Retirement Insurance Company
More Annuity NewsHealth/Employee Benefits News
- Findings from Yonsei University Advance Knowledge in Demography (Different Understandings of Scientific Research in the Use of De-identified Personal Sensitive Data: South Korea, in Comparative Perspectives): Science – Demography
- Data on Influenza Vaccines Discussed by Researchers at University of Lucerne (Keep Reminding Me To Get My Flu Shot): Immunization and Public Health – Influenza Vaccines
- Bobby Harrison: Rising insurance exchange costs bad for working poor
- New Managed Care Findings from Brown University Reported (Prior Authorization In Medicare Advantage: Beneficiary Exposure And Plan Disenrollment In 2021): Managed Care
- Findings on Managed Care Detailed by Researchers at Renal Research Institute (AI-Driven Interventions for Imminent Hospital Admissions in Patients with End-Stage Kidney Disease: A Medicare and EMR-Based Analysis): Managed Care
More Health/Employee Benefits NewsLife Insurance News
- Best’s Market Segment Report: AM Best Maintains Stable Outlook on South Korea’s Non-Life Insurance Market
- Horace Mann Strengthens Customer Relationships and Accelerates Long-Term Growth Through Transactions with Medical Mutual of Ohio
- Regulators: ‘No firm conclusions’ from first offshore reinsurance filings
- Allianz Life Study Finds Americans Struggle to Shift From Retirement Saving to Spending
- The next growth phase in life/annuities depends on modernization
More Life Insurance News