

Fidelity Introduces Industry-First Global Retirement Savings Guidelines
New Global Retirement “Rules of Thumb” Leverage
This press release features multimedia. View the full release here: https://www.businesswire.com/news/home/20181114005475/en/
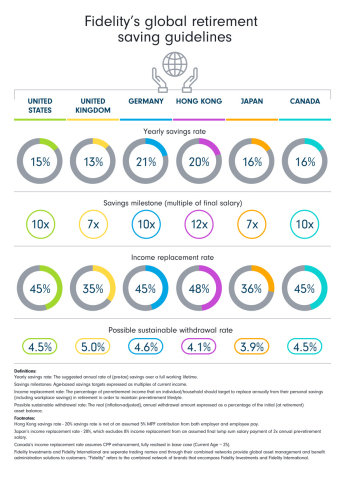
Fidelity's global retirement savings guidelines (Graphic: Business Wire)
Designed to engage workers with clear, simple “rules of thumb” to help keep their retirement savings on track, the global guidelines2 can serve as a starting point for a broader retirement planning discussion and are intended to address two of the most common retirement-related questions from workers: “How much do I need to save for retirement?” and “Am I on track to save enough?”

“Fidelity’s commitment to engaging workers and providing retirement guidance to tens of millions of
The global retirement savings guidelines, which leverage a
Based on the positive response to these retirement guidelines among American workers and employers, Fidelity’s growing roster of multinational clients have asked for similar guidelines for their employees in other geographic regions as they move from defined benefit pension plans to defined contribution plans. Fidelity’s new set of retirement savings guidelines are based on a consistent global framework that, when combined with locally-relevant financial and demographic assumptions, can help multinational companies develop a benefit platforms that can help meet the needs of a global workforce.
“Planning and saving for the future is a challenge facing workers globally,” said
Retirement Age, Investment Returns and Other Factors Can Impact Global Savings Rates
Fidelity’s global retirement savings guidelines are based on several key assumptions3 and calculate a suggested annual savings rate4 and age-based savings milestones for each country. The guidelines also include a target income replacement rate5 and a probable sustainable withdrawal rate, which helps workers understand how much they may be able to withdraw from their savings each year without running out of money in retirement.
Here is what the retirement savings guidelines look like in other parts of the world:
-
United Kingdom . The guidelines for workers in theU.K. are to save a total 13 percent of their annual salary each year and aim to have saved 7X their salary by retirement. This will put them on track to replace 35 percent of their pre-retirement income, which Fidelity estimates, when combined with a government pension, may enable them to maintain a pre-retirement lifestyle throughout retirement. Fidelity’s guidelines forU.K. workers are based on a 5 percent sustainable withdrawal rate in retirement. -
Germany . Certain savings guidelines for workers inGermany are similar to those forU.S. workers. Workers inGermany are encouraged to aim to have saved 10X their final salary upon retirement, which will replace 45 percent of their pre-retirement income. The 4.6 percent withdrawal rate is consistent with the 4.5 percent withdrawal rate forU.S. workers. However, German workers are encouraged to save 21 percent of their salary each year. -
Hong Kong . Workers inHong Kong are encouraged to save 12X their final salary and have a suggested savings rate of 20 percent6, which will put them on track to replace nearly half (48 percent) of their pre-retirement income.Hong Kong workers’ 4.1 percent sustainable withdrawal rate is the second lowest only toJapan . The savings milestones are higher than theU.S. guidelines for several reasons, including the assumed retirement age inHong Kong is earlier, the expected lifespan is longer and the assumed investment returns are on the lower end of the spectrum. -
Japan . Workers inJapan have a suggested savings rate of 16 percent of their annual salary, which is similar to the savings rate forU.S. workers, but Japanese workers are estimated to only need to aim to save 7X their ending salary and replace7 36 percent of their pre-retirement income. Workers inJapan have the lowest probable sustainable withdrawal rate (3.9 percent) due to the lowest expected long-term investment returns among the regions. -
Canada . The retirement savings rate for workers inCanada is only slightly higher than the rate for theirU.S. counterparts. The suggested savings rate for Canadian workers is 16 percent and with a target of saving 10X their final salary, which will replace nearly half (45 percent) of their pre-retirement income. The suggested withdrawal rate of 4.5 percent is in line with theU.S.
“Defined contribution retirement plans are becoming the primary retirement savings vehicle for most
About
Fidelity’s mission is to inspire better futures and deliver better outcomes for the customers and businesses we serve. With assets under administration of
866054.1.0
© 2018
1 The term “Fidelity” can refer to one or both of
2 Guideline values can vary based on changes to such factors as retirement age, retirement lifestyle and life expectancy. Actual guidelines for any individual/household may vary.
3 Fidelity’s guidelines are based on the following information:
INCOME REPLACEMENT RATE
Income Replacement is the level of retirement income expressed as a fraction of pre-retirement income for an individual or a household. More specifically, Income Replacement Rate is defined here as the amount of pre-tax annual income in retirement divided by pre-tax occupational income in the year prior to retirement in current real dollars. This includes savings sourced from defined contribution, state/government benefits and defined benefit where available. While it is impossible without an in-depth interaction to determine the actual income replacement rate an individual will require in retirement, Fidelity generally targets a range of income replacement rates, based on pre-retirement income levels that cover planning though age:
The income replacement targets are based on the following data sources:
| |
|
||
| |
|
||
| |
German: Federal Statistical Office (Destatis): |
||
| |
|
||
| |
|
||
| |
|
||
The income replacement targets for each region assume no private pension income and retirement and state pension claiming ages as follows:
We use a Monte Carlo simulation-based approach to estimate potential growth of account balances through retirement, relying on certain market performance assumptions. The analysis is based on historical market data to project a range of potential outcomes for various hypothetical retirement income portfolios under different market conditions.
SAVINGS FACTOR
The savings factor is a multiple of current salary that an individual should aim to have saved by a given age. Fidelity developed a series of salary multiplier targets corresponding to different ages assuming the following for each region:
Retirement Age:
Annual Savings Rate:
Annual Real Wage Growth:
Planning Age (Life Expectancy):
Personal Income Replacement Target:
* Excludes 10% (5% employer, 5% employee) annual
** Total personal replacement rate is 36%, including 8% income replacement from an assumed retirement lump sum payment (RLSP) of 2X annual final salary.
*** Assumes Canada Pension Plan (CPP) enhancement, fully realized by base case Current Age = 25
The personal replacement income targets are expressed a percentage of pre-retirement income and assume no private pension income. Fidelity developed the salary multipliers through multiple market simulations based on long-term historical market data and assuming a generic age-based asset allocation roll-down, with a lifetime average equity allocation of roughly 50% equity. For the purposes of generating savings factors and other retirement guidelines in the
– Probable sustainable withdrawal rate and the final savings factor (representing the required savings balance at retirement).
Final Savings Factor (Salary Multiplier):
* Total Savings milestone is 9x and includes an assumed retirement lump-sum payment of 2x annual final salary. Savings Factors are based on simulations which in turn are based on long-term historical market data. These simulations take into account the returns and volatility that a typical age-based (target date) asset allocation might experience under different market conditions.
The analysis assumes a level of diversity within each asset class consistent with a market index benchmark that may differ from the diversity of your own portfolio. Please note that the projections do not reflect the impact of any transaction costs or management and servicing fees.
Volatility of the stocks, bonds and short-term asset classes is based on the historical annual data by region as follows:
| |
From 1926 through the most recent year-end data available from |
||
| |
From 1990 through the most recent year-end data available from Bloomberg and Datastream. Stocks (domestic and foreign) are represented by MSCI All Countries World Total Return Index, bonds are represented by Barclay’s Aggregate Total Return Index (Value Hedged (GPB)), and short term are represented by the 3 Month GPB LIBOR rate, respectively. | ||
| |
From 1990 through the most recent year-end data available from Bloomberg and Datastream. Stocks (domestic and foreign) are represented by MSCI All Countries World Total Return Index, bonds are represented by Barclay’s Aggregate Total Return Index (Value Hedged (EUR)), and short term are represented by the 3 Month |
||
| |
From 1990 through the most recent year-end data available from Bloomberg and Datastream. Stocks (domestic and foreign) are represented by MSCI All Countries World Total Return Index, bonds are represented by Barclay’s Aggregate Total Return Index (Value Hedged ($HK)), and short term are represented by the 3 Month HIBOR rate, respectively | ||
| |
From 1990 through the most recent year-end data available from Bloomberg and Datastream. Stocks (domestic and foreign) are represented by MSCI All Countries World Total Return Index, bonds are represented by Barclay’s Aggregate Total Return Index (Value Hedged (JPY)), and short term are represented by the 3 Month JPY LIBOR rate, respectively. | ||
| |
From 1934 through the most recent year-end data available from Bloomberg and Datastream. Stocks are represented as follows: Canadian Equity: TSX 300, US Equity: Fama-French market value-weighted index (1987 – present, Developed Market ex- |
||
It is not possible to invest directly in an index. All indices include reinvestment of dividends and interest income. All calculations are purely hypothetical and a suggested salary multiplier is not a guarantee of future results; it does not reflect the return of any particular investment or take into consideration the composition of a participant’s particular account. The salary multiplier is intended only to be one source of information that may help you assess your retirement income needs. Remember, past performance is no guarantee of future results. Performance returns for actual investments will generally be reduced by fees or expenses not reflected in these hypothetical calculations. Returns also will generally be reduced by taxes.
4 Suggest annual savings rate includes both employee and employer contributions.
5 The income replacement rate for each region represents the percentage of pre-retirement income that Fidelity estimates will be required to come from personal savings in order to maintain a pre-retirement lifestyle throughout retirement (when combined with state pension). The value may vary across regions based on differences in expenditures, taxation, and the level of income replacement from state pension, among other factors.
6
7 Japan’s income replacement rate is 28 percent, which is net of 8 percent income replacement from an assumed final lump sum salary payment of 2X annual pre-retirement salary.

View source version on businesswire.com: https://www.businesswire.com/news/home/20181114005475/en/
Corporate Communications
(617) 563-5800
[email protected]
[email protected]
Source:

Trey Lowack Joins Alliant to Service Growing Southwest Client Base
Uplevel Enables MSPs to Offer HIPAA-compliant IT Services to Small Business
Advisor News
- Health insurance premium tax bill advancing
- The Medi-Cal money pit
- The untapped potential of Qualified Longevity Annuity Contracts
- NYC's fiscal outlook on downslide over budget gaps
- Health insurance premium tax bill moving in Iowa House
More Advisor NewsAnnuity News
- An Application for the Trademark “GREAT-WEST LIFE & ANNUITY INSURANCE COMPANY” Has Been Filed by Great-West Life & Annuity Insurance Company: Great-West Life & Annuity Insurance Company
- The forces shaping life and annuities in 2026
- Variable annuity sales surge as market confidence remains high, Wink finds
- New Allianz Life Annuity Offers Added Flexibility in Income Benefits
- How to elevate annuity discussions during tax season
More Annuity NewsHealth/Employee Benefits News
- From $500 to $1.5K: Marylanders feel financial impact of expired ACA tax credits
- The politics behind America's new health insurance shock
- Health insurance premium tax bill advancing
- Families oppose bill locking in Iowa Medicaid privatization
- The Medi-Cal money pit
More Health/Employee Benefits NewsLife Insurance News
- Hulse, Murray
- Murray Giles Hulse
- Oaktree grabs control of Atlantic Coast Life Co. in blockbuster A-Cap deal
- AM Best Removes From Under Review With Developing Implications and Downgrades Credit Ratings of Banner Life Insurance Company and William Penn Life Insurance Company of New York
- The forces shaping life and annuities in 2026
More Life Insurance News