Life Insurance Activity Returns To Year-Over-Year Growth, MIB Reports

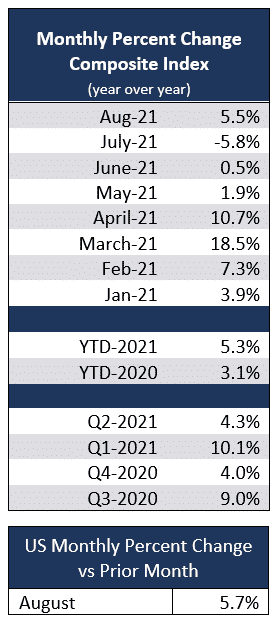
U.S. life insurance application activity returned to growth in August 2021 compared to August 2020 with year-over-year activity up 5.5%, MIB reports.
While year-over-year comparisons are impacted by fluctuations in 2020 activity due to COVID, when comparing results to 2019, August 2021 is up 9.5%, MIB reported. The industry remains on track for a strong year, with 2021 activity up 5.3% over 2020 through August.
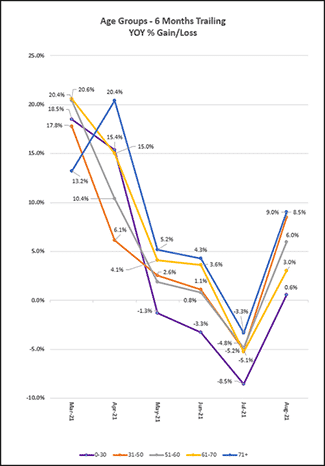
All age groups experienced strong YOY growth in activity for August, except age 0-30, where growth was relatively flat. YOY growth for ages 0-30 was +0.6%, ages 31-50 +8.5%, ages 51-60 +6.0%, ages 61-70 +3.0% and age 71+ +9.0%.
As of the onset of COVID-19 in March 2020 through March 2021, the age 31-50 band has had the lead in growth YOY. However, trends began to shift in April 2021 with the 71+ age band taking the lead in growth. As of August, trends appear to be again shifting and the 31-50 and 71+ age bands are now closely matched for growth.
As noted previously, YOY comparisons to 2020 are impacted by by fluctuations related to COVID-19. When comparing age band activity in August 2021 to August 2019, we see growth across all age bands, in double digits for ages 31-50, but a slight decline of just more than -2% for ages 71+.
Face amounts up to $250K and over $500K showed YOY growth in August, with face amounts over $250K up to and including $500K at a slight decline (less than -2%). Growth for face amounts over $1M was in the double digits, with amounts over $5M growing over 47%. This represents a return to patterns seen between February and June where face amounts over $5M have consistently been at double-digit growth YOY.
Ages 0-30 saw YOY growth with face amounts over $500K, in the double digits for face amounts over $1M. Ages 31-50 saw YOY declines for face amounts over $250K but less than $500K and growth for all other face amounts, in the double digits for amounts over $1M. Age 51-60 saw relatively flat YOY activity for face amounts over $250K up to and including $500K and for amounts over $1M up to and including $2.5M, while all other face amounts saw growth, in the double digits for face amounts over $2.5M.
Ages 61-70 saw YOY growth for face amounts up to and including $250K, and double-digit growth for amounts over $500K. Ages 71+ saw YOY growth across all face amounts, in the double digits for amounts over $500K up to and including $5M.
Continuing a trend that started in April, August 2021 saw declines in Term Life application activity YOY of -2.1%. Universal Life was at growth of +13.8% and Whole Life grew by 9.0%. Activity for Term Life was flat for ages 31-60 but at a decline for all other age bands. Universal Life saw growth for ages 0-60, in the double digits for ages 31-50, declines for ages 61-70 and flat activity for those ages 71+. Whole life saw growth across all age bands, in the double digits for ages 31-70.

Methodology Change for 2021:
MIB has changed the way we report trends in application activity. Effective with our January report, variations with industry activity reflect a straight period over period percent changes (YTD, YOY, MOM, and QOQ) based on calendar days vs. the prior methodology based on a 2011 baseline index on a business day calculation.


Democrats Seek Corporate, Wealthy Tax Hikes For $3.5T Plan
Michigan Shuts Down Fake Bank, Credit Union Websites
Advisor News
- Trump pick for Treasury: extending tax cuts the ‘most important’ issue
- Treasury Secretary nominee Scott Bessent says Trump tax cuts should not expire
- Five retirement-industry trends to watch in 2025
- U.S. military veteran workers report higher levels of financial well-being
- US inflation picked up in December, though underlying price pressures ease
More Advisor NewsAnnuity News
- Midland Advisory Focused on Growing Registered Investment Advisor Channel Presence
- Delaware Life Announces Suite of Innovative Fixed Index Annuities
- Allianz Life moves to strengthen annuity operations with own reinsurer
- Global Atlantic Announces New Registered Index-Linked Annuity
- AM Best Affirms Credit Ratings of Reinsurance Group of America, Incorporated and Subsidiaries
More Annuity NewsHealth/Employee Benefits News
- Insurers question need for prosthetics, limit coverage
- Social Security: Submit your continuing disability review report online
- Is a 'people before profit' model the solution in the United States?
- Missouri proposal could block health insurers from limiting anesthesia coverage
- WA doulas now eligible for highest Medicaid reimbursement in U.S.
More Health/Employee Benefits NewsProperty and Casualty News
- Citizens draws bids for office space in Downtown and South Jacksonville
- North Carolina home insurance premium base rates increasing about 15% by mid-2026
- Here's How Much Getting a Traffic Ticket Will Boost a Driver's Insurance Rates
- Safe driving can help with insurance premiums for teen drivers
- Mercury Insurance Gives Update on Primary Mission: Helping Policyholders Affected by the Southern California Wildfires
More Property and Casualty News