Big Changes May Be Coming to the FIUL Space
Allianz can help you stay ahead of the curve
Today, fixed index universal life (FIUL) represents 25% of a $2.7 billion total life insurance market.1 With so much at stake, it pays to stay on top of how this product segment continues to evolve.
As a leader in the space and ranked No. 4 among top FIUL carrier sales in the independent channel1, Allianz Life Insurance Company of North America (Allianz Life) has developed lengthy experience with — and a vision for — FIUL trends. Some of the company’s thought leaders shared their insights into the current FIUL atmosphere and what may be in store.
What’s next with the Uniform Actuarial Guideline 49 (AG 49)
AG 49 was intended to establish consistency in the methodology used by carriers to determine maximum FIUL illustrated rates. Prior to the guideline, FIUL was being illustrated by some carriers in excess of 11%. AG 49 was successful in reining in some of these unrealistically high assumptions in terms of illustrated rates, but three years after the guideline went into effect, another trend is emerging.
At a recent NAIC Life Actuarial (A) Task Force meeting, a member noted, “There is illustration activity raising red flags.” A key discussion as part of the task force’s illustration subgroup is looking at carriers’ widespread use of performance multipliers on their new products and whether changes to the guideline are needed to ensure clients really understand the risk-reward trade-offs of these new product designs.2
Why bonuses and multipliers are receiving scrutiny

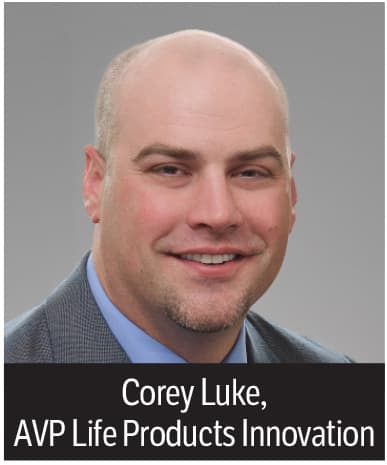
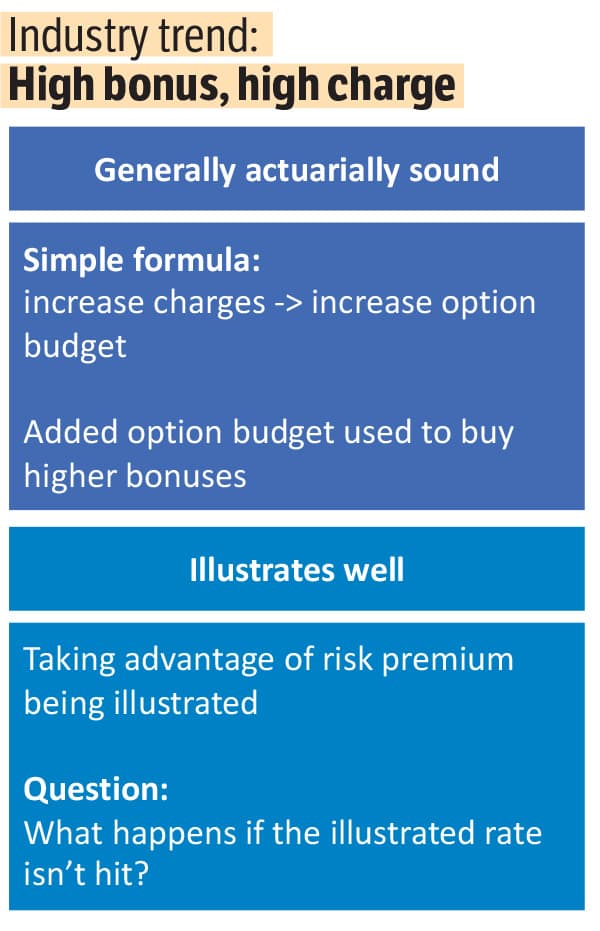
“These new features are typically not free,” said Corey Luke, AVP Life Products Innovation at Allianz. “To increase the bonus or multiplier on a product, you generally need to increase the policy charges as well.

Most FIUL illustrations assume a flat rate — such as 6%, for example — is earned on a policy every year. If the product has a 15% multiplier on top of that, the actual credit to the policy is 6.9% (6 x 1.15 = 6.9). If the product has a 50% multiplier, the actual credit is 9% (6 x 1.5 = 9).
“In reality — and most customers and producers understand this — customers might still average 6% in the end. But in some years, they could receive a unique sequence of returns of 12%, 4%, 8% and even 0%, for example,” said Luke. “In fact, statistically speaking, the S&P 500 Index® — perhaps the most popular index in the industry — returns 0% about every four to five years. The impact of that 0% return year and how often it occurs is not usually disclosed in your typical illustration. Not to mention how the impact on the policy grows the higher the policy charges go.”
Taking the lead on transparency
“Allianz has always had great concern for a customer’s risk tolerance and recognizing that not all customers are the same,” said Wellmann. “Therefore, Allianz is one of the few carriers that requires the customer to review the charges page of the illustration. Allianz also requires that a customer be provided with a sequence of returns impact on their FIUL policy when loans are illustrated. We believe this approach provides transparency to the customer.”
Getting back to the basics of FIUL
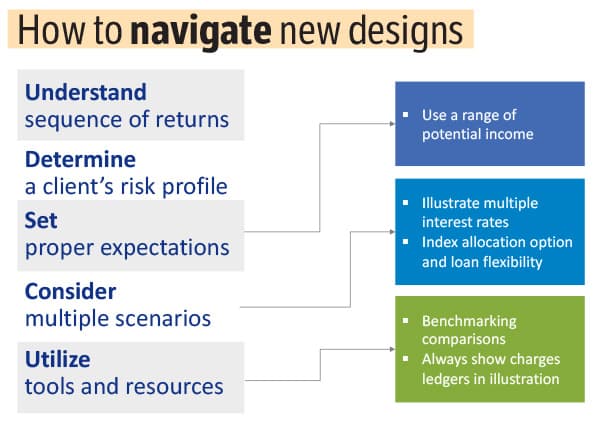
After a careful assessment of a client’s risk tolerance, Luke suggests that financial professionals consider three parts of an illustration to better understand the risk-reward trade-off of their FIUL product.
“Start with the maximum illustrated rate to determine the best-case illustrated scenario, then run the illustration at 70% of that maximum rate to see a more conservative scenario,” said Luke.
The greater the disparity between these two illustrations, the higher the charges and the greater the sensitivity to sequence of returns risk. To validate the disparity, look at the charges page, which will help explain it.
“Considering these two scenarios and the charges page and seeing where various carriers fall can support financial professionals in helping clients select an FIUL policy that is in line with their overall financial strategy and risk tolerance,” said Luke.
Providing these tools and direction are some of the ways Allianz crystallizes decades of experience into actionable assistance for professionals who want to help their clients pursue a successful future. Allianz seeks to provide competitive products that offer clients death benefit protection and accumulation potential.
Allianz is proud to be a leader in indexed solutions and to use its experience and knowledge to develop unique fixed index universal life products. To learn more and to request your sales material, call the Life Case Design Team at 844.652.8352, or visit www.BestPracticeFIUL.com.
1. 1Q 2019 LIMRA’s U.S. Retail Individual Life Insurance Sales by Channel with All Splits
2. Meeting minutes. Life Actuarial (A) Task Force, San Francisco, California, Nov. 13–14, 2018. https://www.naic.org/meetings1811/a_la_tf.pdf


Protecting What We Work To Provide
Legal & General America’s Super-competitive Term Options Appeal to Budget-conscious Buyers
Advisor News
- Americans fear running out of money more than death
- Caregiving affects ‘sandwich generation’s’ retirement plans
- Why financial consciousness is the key to long-term clarity
- Selling long-term-care insurance in a group setting
- How to overcome the fear of calling prospects
More Advisor NewsAnnuity News
Health/Employee Benefits News
- Low-income diabetes patients more likely to be uninsured
- UnitedHealth execs bemoan ‘unusual and unacceptable’ Q1 financials
- LTCi proves its value beyond peace of mind
- Governor signs ban on drug middlemen owning pharmacies
- The lighter side of The News: Political theater; A bone to pick with a Yankee; Health insurers have mascots?
More Health/Employee Benefits NewsLife Insurance News
- Americans fear running out of money more than death
- NAIFA eyes tax reform, retirement issues in 2025
- Legislation would change tax treatment of life insurers’ debt investments
- Closing the life insurance coverage gap by investing in education
- IUL sales: How to overcome ‘it’s too complicated’
More Life Insurance News