

Trupanion Reports Second Quarter 2023 Results
“In the second quarter, we saw early signs of margin expansion, while exercising discipline in our capital deployment. As a result, we delivered sequential improvement in free cash flow, marking progress towards our goal of being free cash flow positive in the fourth quarter of 2023,” said
Second Quarter 2023 Financial and Business Highlights

- Total revenue was
$270.6 million , an increase of 23% compared to the second quarter of 2022. - Total enrolled pets (including pets from our other business segment) was 1,679,659 at
June 30, 2023 , an increase of 25% over the second quarter of 2022. - Subscription business revenue was
$173.3 million , an increase of 19% compared to the second quarter of 2022 (20% on a constant currency basis). - Subscription enrolled pets was 943,958 at
June 30, 2023 , an increase of 23% over the second quarter of 2022. - Net loss was
$(13.7) million , or$(0.33) per basic and diluted share, compared to net loss of$(13.6) million , or$(0.33) per basic and diluted share, in the second quarter of 2022. - Adjusted EBITDA was
$(3.2) million , compared to adjusted EBITDA of$(1.7) million in the second quarter of 2022. - Operating cash flow was
$(3.4) million and free cash flow was$(8.1) million in the second quarter of 2023. This compared to operating cash flow of$(3.1) million and free cash flow of$(7.1) million in the second quarter of 2022. Sequentially, free cash flow improved$3.9 million from the first quarter of 2023.
First Half 2023 Financial and Business Highlights
- Total revenue was
$526.9 million , an increase of 24% compared to the first half of 2022. - Subscription business revenue was
$338.5 million , an increase of 18% compared to the first half of 2022 (20% on a constant currency basis). - Net loss was
$(38.5) million , or$(0.93) per basic and diluted share, compared to net loss of$(22.5) million , or$(0.55) per basic and diluted share, in the first half of 2022. Net loss for the six months endedJune 30, 2023 included$4.2 million , or$0.10 per basic and diluted share, of non-recurring expenses - Adjusted EBITDA was
$(8.1) million , compared to adjusted EBITDA of$(0.5) million in the first half of 2022. - Operating cash flow was
$(10.3) million and free cash flow was$(20.2) million in the first half of 2023. This compared to operating cash flow of$(6.7) million and free cash flow of$(14.2) million in the first half of 2022. - At
June 30th, 2023 , the Company held$236.1 million in cash and short-term investments. The Company maintained$213.1 million of capital surplus at its insurance subsidiaries. This was$57.3 million more than the estimated risk-based capital requirement of$155.8 million . In addition to these insurance entities, the Company held$25.4 million in cash & short-term investments at the end of the quarter, with additional$40 million available under its credit facility.
Conference Call
Trupanion’s management will host a conference call today to review its second quarter 2023 results. The call is scheduled to begin shortly after
About
Forward-Looking Statements
This press release contains forward-looking statements within the meaning of Section 27A of the Securities Act of 1933 and Section 21E of the Securities Exchange Act of 1934 relating to, among other things, expectations, plans, prospects and financial results for
In particular, the following factors, among others, could cause results to differ materially from those expressed or implied by such forward-looking statements: the ability to achieve or maintain profitability and/or appropriate levels of cash flow in future periods; the ability to keep growing our membership base and revenue; the accuracy of assumptions used in determining appropriate member acquisition expenditures; the severity and frequency of claims; the ability to maintain high retention rates; the accuracy of assumptions used in pricing medical plan subscriptions and the ability to accurately estimate the impact of new products or offerings on claims frequency; actual claims expense exceeding estimates; regulatory and other constraints on the ability to institute, or the decision to otherwise delay, pricing modifications in response to changes in actual or estimated claims expense; the effectiveness and statutory or regulatory compliance of our Territory Partner model and of our
For a detailed discussion of these and other cautionary statements, please refer to the risk factors discussed in filings with the
Non-GAAP Financial Measures
Trupanion’s stated results may include certain non-GAAP financial measures. These non-GAAP financial measures may not provide information that is directly comparable to that provided by other companies in its industry as other companies in its industry may calculate or use non-GAAP financial measures differently. In addition, there are limitations in using non-GAAP financial measures because the non-GAAP financial measures are not prepared in accordance with GAAP, may be different from non-GAAP financial measures used by other companies and exclude expenses that may have a material impact on Trupanion’s reported financial results. The presentation and utilization of non-GAAP financial measures is not meant to be considered in isolation or as a substitute for the directly comparable financial measures prepared in accordance with GAAP.
Because of varying available valuation methodologies, subjective assumptions and the variety of equity instruments that can impact a company’s non-cash expenses,
Condensed Consolidated Statements of Operations (in thousands, except share data) |
|||||||||||||||
| Three Months Ended |
Six Months Ended |
||||||||||||||
| 2023 | 2022 | 2023 | 2022 | ||||||||||||
| (unaudited) | |||||||||||||||
| Revenue: | |||||||||||||||
| Subscription business | $ | 173,253 | $ | 145,808 | $ | 338,463 | $ | 285,647 | |||||||
| Other business | 97,313 | 73,603 | 188,432 | 139,763 | |||||||||||
| Total revenue | 270,566 | 219,411 | 526,895 | 425,410 | |||||||||||
| Cost of revenue: | |||||||||||||||
| Subscription business(1) | 151,520 | 122,440 | 297,611 | 237,703 | |||||||||||
| Other business | 89,673 | 68,388 | 173,565 | 129,230 | |||||||||||
| Total cost of revenue(2) | 241,193 | 190,828 | 471,176 | 366,933 | |||||||||||
| Operating expenses: | |||||||||||||||
| Technology and development(1) | 5,232 | 6,396 | 10,132 | 11,625 | |||||||||||
| General and administrative(1) | 13,136 | 9,227 | 34,153 | 18,593 | |||||||||||
| New pet acquisition expense(1) | 20,769 | 22,982 | 42,411 | 44,609 | |||||||||||
| Depreciation and amortization | 3,253 | 2,707 | 6,455 | 5,424 | |||||||||||
| Total operating expenses | 42,390 | 41,312 | 93,151 | 80,251 | |||||||||||
| Gain (loss) from investment in joint venture | (73 | ) | (42 | ) | (144 | ) | (111 | ) | |||||||
| Operating loss | (13,090 | ) | (12,771 | ) | (37,576 | ) | (21,885 | ) | |||||||
| Interest expense | 2,940 | 1,193 | 5,327 | 1,272 | |||||||||||
| Other income, net | (2,078 | ) | (365 | ) | (3,980 | ) | (679 | ) | |||||||
| Loss before income taxes | (13,952 | ) | (13,599 | ) | (38,923 | ) | (22,478 | ) | |||||||
| Income tax expense (benefit) | (238 | ) | 19 | (429 | ) | (5 | ) | ||||||||
| Net loss | $ | (13,714 | ) | $ | (13,618 | ) | $ | (38,494 | ) | $ | (22,473 | ) | |||
| Net loss per share: | |||||||||||||||
| Basic and diluted | $ | (0.33 | ) | $ | (0.33 | ) | $ | (0.93 | ) | $ | (0.55 | ) | |||
| Weighted average shares of common stock outstanding: | |||||||||||||||
| Basic and diluted | 41,383,411 | 40,738,738 | 41,246,411 | 40,660,797 | |||||||||||
| (1)Includes stock-based compensation expense as follows: | Three Months Ended |
Six Months Ended |
|||||||||||||
| 2023 | 2022 | 2023 | 2022 | ||||||||||||
| Cost of revenue | $ | 1,307 | $ | 1,830 | $ | 2,625 | $ | 3,666 | |||||||
| Technology and development | 627 | 1,101 | 1,335 | 2,009 | |||||||||||
| General and administrative | 2,948 | 3,066 | 11,167 | 5,489 | |||||||||||
| New pet acquisition expense | 1,755 | 2,637 | 3,841 | 5,019 | |||||||||||
| Total stock-based compensation expense | $ | 6,637 | $ | 8,634 | $ | 18,968 | $ | 16,183 | |||||||
| (2)The breakout of cost of revenue between veterinary invoice expense and other cost of revenue is as follows: | |||||||||||||||
| Three Months Ended |
Six Months Ended |
||||||||||||||
| 2023 | 2022 | 2023 | 2022 | ||||||||||||
| Veterinary invoice expense | $ | 206,738 | $ | 157,616 | $ | 400,875 | $ | 302,542 | |||||||
| Other cost of revenue | 34,455 | 33,212 | 70,301 | 64,391 | |||||||||||
| Total cost of revenue | $ | 241,193 | $ | 190,828 | $ | 471,176 | $ | 366,933 | |||||||
Condensed Consolidated Balance Sheets (in thousands, except share data) |
|||||||
| (unaudited) | |||||||
| Assets | |||||||
| Current assets: | |||||||
| Cash and cash equivalents | $ | 118,417 | $ | 65,605 | |||
| Short-term investments | 117,648 | 156,804 | |||||
| Accounts and other receivables, net of allowance for doubtful accounts of |
265,648 | 232,439 | |||||
| Prepaid expenses and other assets | 18,882 | 14,248 | |||||
| Total current assets | 520,595 | 469,096 | |||||
| Restricted cash | 18,131 | 19,032 | |||||
| Long-term investments | 9,818 | 7,841 | |||||
| Property, equipment and internal-use software, net | 97,984 | 90,701 | |||||
| Intangible assets, net | 21,633 | 24,031 | |||||
| Other long-term assets | 18,153 | 18,943 | |||||
| 43,877 | 41,983 | ||||||
| Total assets | $ | 730,191 | $ | 671,627 | |||
| Liabilities and stockholders’ equity | |||||||
| Current liabilities: | |||||||
| Accounts payable | $ | 6,918 | $ | 9,471 | |||
| Accrued liabilities and other current liabilities | 29,893 | 32,616 | |||||
| Reserve for veterinary invoices | 56,202 | 43,734 | |||||
| Deferred revenue | 236,545 | 202,692 | |||||
| Long-term debt - current portion | 1,100 | 1,103 | |||||
| Total current liabilities | 330,658 | 289,616 | |||||
| Long-term debt | 102,934 | 68,354 | |||||
| Deferred tax liabilities | 2,940 | 3,392 | |||||
| Other liabilities | 4,901 | 4,968 | |||||
| Total liabilities | 441,433 | 366,330 | |||||
| Stockholders’ equity: | |||||||
| Common stock: |
— | — | |||||
| Preferred stock: |
— | — | |||||
| Additional paid-in capital | 519,450 | 499,694 | |||||
| Accumulated other comprehensive loss | (4,102 | ) | (6,301 | ) | |||
| Accumulated deficit | (210,056 | ) | (171,562 | ) | |||
| (16,534 | ) | (16,534 | ) | ||||
| Total stockholders’ equity | 288,758 | 305,297 | |||||
| Total liabilities and stockholders’ equity | $ | 730,191 | $ | 671,627 | |||
Condensed Consolidated Statements of Cash Flows (in thousands) |
|||||||||||||||
| Three Months Ended |
Six Months Ended |
||||||||||||||
| 2023 | 2022 | 2023 | 2022 | ||||||||||||
| (unaudited) | |||||||||||||||
| Operating activities | |||||||||||||||
| Net loss | $ | (13,714 | ) | $ | (13,618 | ) | $ | (38,494 | ) | $ | (22,473 | ) | |||
| Adjustments to reconcile net loss to cash provided by (used in) operating activities: | |||||||||||||||
| Depreciation and amortization | 3,253 | 2,707 | 6,455 | 5,424 | |||||||||||
| Stock-based compensation expense | 6,637 | 8,634 | 18,968 | 16,183 | |||||||||||
| Other, net | (188 | ) | 5 | (585 | ) | (74 | ) | ||||||||
| Changes in operating assets and liabilities: | |||||||||||||||
| Accounts and other receivables | (17,337 | ) | (15,312 | ) | (33,184 | ) | (39,127 | ) | |||||||
| Prepaid expenses and other assets | 552 | (761 | ) | (3,213 | ) | (2,821 | ) | ||||||||
| Accounts payable, accrued liabilities, and other liabilities | (1,316 | ) | 2,509 | (6,464 | ) | 703 | |||||||||
| Reserve for veterinary invoices | 7,833 | (1,785 | ) | 12,439 | (2,998 | ) | |||||||||
| Deferred revenue | 10,875 | 14,491 | 33,811 | 38,463 | |||||||||||
| Net cash provided by (used in) operating activities | (3,405 | ) | (3,130 | ) | (10,267 | ) | (6,720 | ) | |||||||
| Investing activities | |||||||||||||||
| Purchases of investment securities | (45,136 | ) | (24,476 | ) | (79,931 | ) | (47,368 | ) | |||||||
| Maturities and sales of investment securities | 43,859 | 19,013 | 117,652 | 31,212 | |||||||||||
| Purchases of property, equipment, and internal-use software | (4,735 | ) | (3,926 | ) | (9,919 | ) | (7,479 | ) | |||||||
| Other | 483 | (1,497 | ) | 583 | (1,502 | ) | |||||||||
| Net cash provided by (used in) investing activities | (5,529 | ) | (10,886 | ) | 28,385 | (25,137 | ) | ||||||||
| Financing activities | |||||||||||||||
| Proceeds from debt financing, net of financing fees | — | (32 | ) | 35,130 | 54,431 | ||||||||||
| Repayment of debt financing | (435 | ) | (150 | ) | (1,042 | ) | (150 | ) | |||||||
| Repurchases of common stock | — | (5,751 | ) | — | (5,751 | ) | |||||||||
| Proceeds from exercise of stock options | 513 | 571 | 653 | 1,171 | |||||||||||
| Shares withheld to satisfy tax withholding | (171 | ) | (632 | ) | (1,024 | ) | (2,930 | ) | |||||||
| Net cash provided by (used in) financing activities | (93 | ) | (5,994 | ) | 33,717 | 46,771 | |||||||||
| Effect of foreign exchange rate changes on cash, cash equivalents, and restricted cash, net | (184 | ) | (835 | ) | 76 | (696 | ) | ||||||||
| Net change in cash, cash equivalents, and restricted cash | (9,211 | ) | (20,845 | ) | 51,911 | 14,218 | |||||||||
| Cash, cash equivalents, and restricted cash at beginning of period | 145,759 | 135,932 | 84,637 | 100,869 | |||||||||||
| Cash, cash equivalents, and restricted cash at end of period | $ | 136,548 | $ | 115,087 | $ | 136,548 | $ | 115,087 | |||||||
The following tables set forth our key operating metrics:
| Six Months Ended |
|||||||||||||||||||||||||||||||
| 2023 | 2022 | ||||||||||||||||||||||||||||||
| Total Business: | |||||||||||||||||||||||||||||||
| Total pets enrolled (at period end) | 1,679,659 | 1,348,145 | |||||||||||||||||||||||||||||
| Subscription Business: | |||||||||||||||||||||||||||||||
| Total subscription pets enrolled (at period end) | 943,958 | 770,318 | |||||||||||||||||||||||||||||
| Monthly average revenue per pet | $ | 64.00 | $ | 64.24 | |||||||||||||||||||||||||||
| Lifetime value of a pet, including fixed expenses | $ | 470 | $ | 713 | |||||||||||||||||||||||||||
| Average pet acquisition cost (PAC) | $ | 241 | $ | 305 | |||||||||||||||||||||||||||
| Average monthly retention | 98.61 | % | 98.74 | % | |||||||||||||||||||||||||||
| Three Months Ended | |||||||||||||||||||||||||||||||
| Total Business: | |||||||||||||||||||||||||||||||
| Total pets enrolled (at period end) | 1,679,659 | 1,616,865 | 1,537,573 | 1,439,605 | 1,348,145 | 1,267,253 | 1,176,778 | 1,104,376 | |||||||||||||||||||||||
| Subscription Business: | |||||||||||||||||||||||||||||||
| Total subscription pets enrolled (at period end) | 943,958 | 906,369 | 869,862 | 808,077 | 770,318 | 736,691 | 704,333 | 676,463 | |||||||||||||||||||||||
| Monthly average revenue per pet | $ | 64.41 | $ | 63.58 | $ | 63.11 | $ | 63.80 | $ | 64.26 | $ | 64.21 | $ | 63.89 | $ | 63.60 | |||||||||||||||
| Lifetime value of a pet, including fixed expenses | $ | 470 | $ | 541 | $ | 641 | $ | 673 | $ | 713 | $ | 730 | $ | 717 | $ | 697 | |||||||||||||||
| Average pet acquisition cost (PAC) | $ | 236 | $ | 247 | $ | 283 | $ | 268 | $ | 309 | $ | 301 | $ | 306 | $ | 280 | |||||||||||||||
| Average monthly retention | 98.61 | % | 98.65 | % | 98.69 | % | 98.71 | % | 98.74 | % | 98.75 | % | 98.74 | % | 98.72 | % | |||||||||||||||
Total pets enrolled and total subscription pets enrolled include pet enrollments in European markets, where policies are currently underwritten by third parties and
| The following table reflects the reconciliation of cash provided by operating activities to free cash flow (in thousands): | |||||||||||||||
| Three Months Ended |
Six Months Ended |
||||||||||||||
| 2023 | 2022 | 2023 | 2022 | ||||||||||||
| Net cash used in operating activities | $ | (3,405 | ) | $ | (3,130 | ) | $ | (10,267 | ) | $ | (6,720 | ) | |||
| Purchases of property, equipment, and internal-use software | (4,735 | ) | (3,926 | ) | (9,919 | ) | (7,479 | ) | |||||||
| Free cash flow | $ | (8,140 | ) | $ | (7,056 | ) | $ | (20,186 | ) | $ | (14,199 | ) | |||
| The following tables reflect the reconciliation between GAAP and non-GAAP measures (in thousands except percentages): | ||||||||||||||||
| Three Months Ended |
Six Months Ended |
|||||||||||||||
| 2023 | 2022 | 2023 | 2022 | |||||||||||||
| Veterinary invoice expense | $ | 206,738 | $ | 157,616 | $ | 400,875 | $ | 302,542 | ||||||||
| Less: | ||||||||||||||||
| Stock-based compensation expense1 | (856 | ) | (1,022 | ) | (1,695 | ) | (2,195 | ) | ||||||||
| Other business cost of paying veterinary invoices | (72,443 | ) | (50,378 | ) | (137,592 | ) | (94,714 | ) | ||||||||
| Subscription cost of paying veterinary invoices (non-GAAP) | $ | 133,439 | $ | 106,216 | $ | 261,588 | $ | 205,633 | ||||||||
| % of subscription revenue | 77.0 | % | 72.8 | % | 77.3 | % | 72.0 | % | ||||||||
| Other cost of revenue | $ | 34,455 | $ | 33,212 | $ | 70,301 | $ | 64,391 | ||||||||
| Less: | ||||||||||||||||
| Stock-based compensation expense1 | (428 | ) | (754 | ) | (876 | ) | (1,385 | ) | ||||||||
| Other business variable expenses | (17,230 | ) | (18,010 | ) | (35,973 | ) | (34,516 | ) | ||||||||
| Subscription variable expenses (non-GAAP) | $ | 16,797 | $ | 14,448 | $ | 33,452 | $ | 28,490 | ||||||||
| % of subscription revenue | 9.7 | % | 9.9 | % | 9.9 | % | 10.0 | % | ||||||||
| Technology and development expense | $ | 5,232 | $ | 6,396 | $ | 10,132 | $ | 11,625 | ||||||||
| General and administrative expense | 13,136 | 9,227 | 34,153 | 18,593 | ||||||||||||
| Less: | ||||||||||||||||
| Stock-based compensation expense1 | (3,497 | ) | (4,085 | ) | (12,318 | ) | (7,311 | ) | ||||||||
| Non-recurring transaction or restructuring expenses2 | (65 | ) | — | (4,167 | ) | — | ||||||||||
| Development expenses3 | (925 | ) | (2,012 | ) | (1,823 | ) | (3,270 | ) | ||||||||
| Fixed expenses (non-GAAP) | $ | 13,881 | $ | 9,526 | $ | 25,977 | $ | 19,637 | ||||||||
| % of total revenue | 5.1 | % | 4.3 | % | 4.9 | % | 4.6 | % | ||||||||
| New pet acquisition expense | $ | 20,769 | $ | 22,982 | $ | 42,411 | $ | 44,609 | ||||||||
| Less: | ||||||||||||||||
| Stock-based compensation expense1 | (1,722 | ) | (2,601 | ) | (3,754 | ) | (4,929 | ) | ||||||||
| Other business pet acquisition expense | (62 | ) | (186 | ) | (113 | ) | (295 | ) | ||||||||
| Subscription acquisition cost (non-GAAP) | $ | 18,985 | $ | 20,195 | $ | 38,544 | $ | 39,385 | ||||||||
| % of subscription revenue | 11.0 | % | 13.9 | % | 11.4 | % | 13.8 | % | ||||||||
| 1 |
||||||||||||||||
| 2Consists of business acquisition transaction expenses, severance and legal costs due to certain executives' departures, and a |
||||||||||||||||
| 3As we enter the next phase of our growth, we expect to invest in initiatives that are pre-revenue, including adding new products and international expansion. These development expenses are costs related to product exploration and development that are pre-revenue and historically have been insignificant. We view these activities as uses of our adjusted operating income separate from pet acquisition spend. | ||||||||||||||||
| The following tables reflect the reconciliation of new pet acquisition expense, previously called "sales and marketing", to acquisition cost and net acquisition cost (in thousands): | |||||||||||||||||||||||||||||||
| Six Months Ended |
|||||||||||||||||||||||||||||||
| 2023 | 2022 | ||||||||||||||||||||||||||||||
| New pet acquisition expense | $ | 42,411 | $ | 44,609 | |||||||||||||||||||||||||||
| Excluding: | |||||||||||||||||||||||||||||||
| Stock-based compensation expense | (3,754 | ) | (4,929 | ) | |||||||||||||||||||||||||||
| Acquisition cost | 38,657 | 39,680 | |||||||||||||||||||||||||||||
| Net of: | |||||||||||||||||||||||||||||||
| Sign-up fee revenue | (2,408 | ) | (2,454 | ) | |||||||||||||||||||||||||||
| Other business segment pet acquisition expense | (113 | ) | (295 | ) | |||||||||||||||||||||||||||
| Pet acquisition expense for commission-based policies | (1,815 | ) | — | ||||||||||||||||||||||||||||
| Net acquisition cost | $ | 34,321 | $ | 36,931 | |||||||||||||||||||||||||||
| Three Months Ended | |||||||||||||||||||||||||||||||
| New pet acquisition expense | $ | 20,769 | $ | 21,642 | $ | 22,457 | $ | 22,434 | $ | 22,982 | $ | 21,627 | $ | 19,845 | $ | 19,708 | |||||||||||||||
| Excluding: | |||||||||||||||||||||||||||||||
| Stock-based compensation expense | (1,722 | ) | (2,032 | ) | (2,079 | ) | (2,108 | ) | (2,601 | ) | (2,328 | ) | (2,136 | ) | (2,112 | ) | |||||||||||||||
| Acquisition cost | 19,047 | 19,610 | 20,378 | 20,326 | 20,381 | 19,299 | 17,709 | 17,596 | |||||||||||||||||||||||
| Net of: | |||||||||||||||||||||||||||||||
| Sign-up fee revenue | (1,189 | ) | (1,219 | ) | (1,191 | ) | (1,339 | ) | (1,252 | ) | (1,202 | ) | (1,162 | ) | (1,268 | ) | |||||||||||||||
| Other business segment pet acquisition expense | (62 | ) | (51 | ) | (65 | ) | (181 | ) | (186 | ) | (109 | ) | (76 | ) | (134 | ) | |||||||||||||||
| Pet acquisition expense for commission-based policies | (888 | ) | (927 | ) | (443 | ) | — | — | — | — | — | ||||||||||||||||||||
| Net acquisition cost | $ | 16,908 | $ | 17,413 | $ | 18,679 | $ | 18,806 | $ | 18,943 | $ | 17,988 | $ | 16,471 | $ | 16,194 | |||||||||||||||
| The following tables reflect the reconciliation of adjusted EBITDA to net loss (in thousands): | |||||||||||||||||||||||||||||||
| Six Months Ended |
|||||||||||||||||||||||||||||||
| 2023 | 2022 | ||||||||||||||||||||||||||||||
| Net loss | $ | (38,494 | ) | $ | (22,473 | ) | |||||||||||||||||||||||||
| Excluding: | |||||||||||||||||||||||||||||||
| Stock-based compensation expense | 18,643 | 15,819 | |||||||||||||||||||||||||||||
| Depreciation and amortization expense | 6,455 | 5,424 | |||||||||||||||||||||||||||||
| Interest income | (3,780 | ) | (394 | ) | |||||||||||||||||||||||||||
| Interest expense | 5,327 | 1,272 | |||||||||||||||||||||||||||||
| Other non-operating expenses | — | (1 | ) | ||||||||||||||||||||||||||||
| Income tax benefit | (429 | ) | (5 | ) | |||||||||||||||||||||||||||
| Non-recurring transaction or restructuring expenses | 4,167 | — | |||||||||||||||||||||||||||||
| (Gain) loss from equity method investment | — | (131 | ) | ||||||||||||||||||||||||||||
| Adjusted EBITDA | $ | (8,111 | ) | $ | (489 | ) | |||||||||||||||||||||||||
| Three Months Ended | |||||||||||||||||||||||||||||||
| Net loss | $ | (13,714 | ) | $ | (24,780 | ) | $ | (9,285 | ) | $ | (12,914 | ) | $ | (13,618 | ) | $ | (8,855 | ) | $ | (7,042 | ) | $ | (6,819 | ) | |||||||
| Excluding: | |||||||||||||||||||||||||||||||
| Stock-based compensation expense | 6,503 | 12,140 | 8,412 | 8,306 | 8,462 | 7,358 | 6,808 | 6,443 | |||||||||||||||||||||||
| Depreciation and amortization expense | 3,253 | 3,202 | 2,897 | 2,600 | 2,707 | 2,717 | 2,770 | 2,944 | |||||||||||||||||||||||
| Interest income | (2,051 | ) | (1,729 | ) | (1,614 | ) | (1,018 | ) | (297 | ) | (97 | ) | (80 | ) | (85 | ) | |||||||||||||||
| Interest expense | 2,940 | 2,387 | 1,587 | 1,408 | 1,193 | 79 | 9 | — | |||||||||||||||||||||||
| Other non-operating expenses | — | — | — | — | (1 | ) | — | — | (1 | ) | |||||||||||||||||||||
| Income tax expense (benefit) | (238 | ) | (191 | ) | (15 | ) | 496 | 19 | (24 | ) | 1,034 | (312 | ) | ||||||||||||||||||
| Non-recurring transaction or restructuring expenses | 65 | 4,102 | 193 | 179 | — | — | — | — | |||||||||||||||||||||||
| (Gain) loss from equity method investment | — | — | — | — | (131 | ) | — | — | — | ||||||||||||||||||||||
| Adjusted EBITDA | $ | (3,242 | ) | $ | (4,869 | ) | $ | 2,175 | $ | (943 | ) | $ | (1,666 | ) | $ | 1,178 | $ | 3,499 | $ | 2,170 | |||||||||||
Contacts:
Investors:
[email protected]

![]()
Trupanion Reports Second Quarter 2023 Results
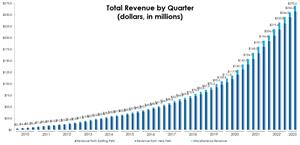
Total Revenue by Quarter
Source:

ICF Reports Second Quarter 2023 Results
Uninsured rate hits record low, just as millions start losing Medicaid coverage
Advisor News
- What advisors think about pooled employer plans, alternative investments
- AI, stablecoins and private market expansion may reshape financial services by 2030
- Cheers to summer, and planning for what comes next
- Why seniors fear spending their own retirement wealth
- The McEwen Group Merges with Prairie Wealth Advisors to Form Billion Dollar RIA
More Advisor NewsAnnuity News
- AuguStar Retirement launches StarStream Variable Annuity
- Prismic Life Announces Completion of Oversubscribed Capital Raise
- Guaranteed income streams help preserve assets later in retirement
- MassMutual turns 175, Marking Generations of Delivering on its Commitments
- ALIRT Insurance Research: U.S. Life Insurance Industry In Transition
More Annuity NewsHealth/Employee Benefits News
- Providence to end most health insurance plans, forcing hundreds of thousands in Oregon to switch
- Flemington-Raritan Seeking Assistance From State Regarding Rising Health Insurance Costs
- Mandela Barnes proposes blocking use of AI to boost consumer prices
- NCOIL adopts Individual Coverage Health Reimbursement Arrangement Model Act
- All about AHCCCS: Navigating Arizona Medicaid’s changing landscape
More Health/Employee Benefits NewsLife Insurance News
- AI, stablecoins and private market expansion may reshape financial services by 2030
- Transgender plaintiffs win preliminary victories in three gender-affirming care lawsuits
- AM Best Upgrades Issuer Credit Rating of Southern Farm Bureau Life Insurance Company
- Industry Innovator Scores New High-Water Mark: Reliance Matrix Logs 8 Millionth Employee Benefit/Absence Claim
- $150M+ asset sale payout distributed to Greg Lindberg policyholders
More Life Insurance News