Salt Financial Annuity Index analytics report for 2024

Below is the December version of the Salt Financial Annuity Index Report, which also serves as the full-year report for 2024. One index was added over the last month, the First Trust Growth Strength™ Net Fee Index, featured in a RILA at Pacific Life.
Annuity Index Analytics: Year-End Review
- Solid U.S. equity and gold returns with international, small caps, and bonds weaker
- Stronger performance in equity-only volatility-controlled strategies vs. multi-asset
- Two-thirds of all indices generated a positive return—and 87% of all equity-only indices
- Better risk-adjusted returns for the broader market (SPY) vs. technology shares (QQQ), which impacted volatility-controlled performance
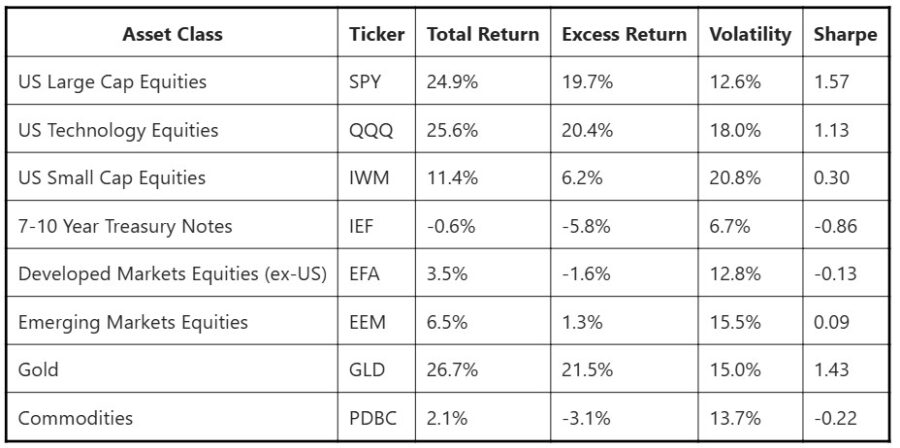
Here is a year-end snapshot of 2024 performance for a selection of asset classes, each proxied with a liquid ETF listed on US markets:

Focusing first on total return, U.S. equities posted a solid year with U.S. large caps (SPY) rising almost 25% and the technology-heavy Nasdaq-100 notching a bit more. Gold rallied even higher (+26.7%) whereas small caps and international equities again lagged U.S. large caps and U.S. Treasuries also posted another disappointing year.
Most volatility-controlled indices offered as crediting strategies in FIAs are excess return, meaning a risk-free rate of interest is deducted from the index return before the policyholder can begin earning credits. This helps stabilize the price of the options used to hedge the index, which can lead to more a consistent experience in terms of participation. The average Effective Federal Funds Rate for 2024 was 5.15%, which was deducted from the returns above in the fourth column to provide a more realistic picture of the performance potentially driving the components of a typical volatility-controlled index.
Using this lens, bonds fared much worse with 7-10 year U.S. Treasuries (IEF) falling almost 6% and broader-based commodities also declining a little over 3% (despite the fact strong-performing gold is a major component in the basket). Weak performance from bonds and commodities outside of gold weighed on returns for volatility-controlled, multi-asset indices versus equity-only (or “equity-forward”) designs.
The last two columns show one-year (daily) realized volatility and the Sharpe ratio (excess return/volatility) for each asset class. One thing to note is that despite similar nominal returns for the year, volatility in technology shares (QQQ) was considerably higher than the broader market (SPY). QQQ volatility was 144% of SPY volatility in 2024—above its ten-year average of about 129%. As a result, risk-adjusted returns for QQQ were almost a third lower than SPY with Sharpe ratios of 1.13 and 1.57 respectively. For indices targeting volatility, that makes it more difficult to earn credits as less of the return is “available” when volatility is held constant.
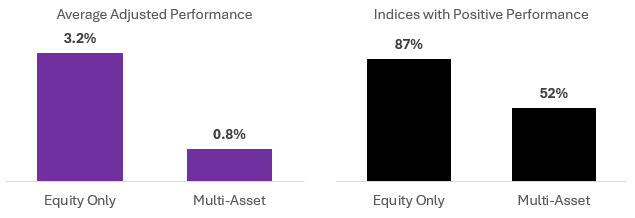
The underlying asset class performance, level of interest rates, and relative volatility of different segments of the equity market all provide context for what led in terms of volatility-controlled index performance in 2024. To begin, the average equity-only index (adjusted to standard 5%/50 bp fee) gained 3.2% in 2024 compared to only 0.8% for the average multi-asset index. 87% of equity-only indices had a positive return for the year compared to only 52% for multi-asset. However, the average multi-asset index did a little better on a relative basis with 37% of them outperforming a passive SPY/IEF volatility-controlled combo compared to just 17% of the equity-only indices that outperformed a passive volatility-controlled SPY.

Helped by strong risk-adjusted returns, equity-only indices with S&P 500 or similar U.S. large cap exposure led the board versus some of the technology and thematic underliers that were more volatile despite posting strong returns for the year.
Multi-asset indices were more of a mixed bag but a common element for the top performers was going beyond just diversification and adding fundamental filters, tactical momentum, and more dynamic approaches to asset allocation.
While equity-only indices remain in favor and have outperformed, market cycles never last forever and yesterday’s losers can become today’s winners relatively quickly. With the long time horizons in index annuities, a more diversified approach to selecting indices for crediting can be a smart choice, allowing some of the market’s ebbs and flows to work in your client's favor.
As always, if you have questions, comments, or suggestions, please do not hesitate to contact us at [email protected].


ACA hits record enrollment days ahead of sign-up deadline
It’s a new year: How will you reinvigorate your client service?
Advisor News
- Private equity, crypto and the risks retirees can’t ignore
- Will Trump accounts lead to a financial boon? Experts differ on impact
- Helping clients up the impact of their charitable giving with a DAF
- 3 tax planning strategies under One Big Beautiful Bill
- Gen X’s retirement readiness is threatened
More Advisor NewsHealth/Employee Benefits News
Life Insurance News
- Seritage Growth Properties Makes $20 Million Loan Prepayment
- AM Best Revises Outlooks to Negative for Kansas City Life Insurance Company; Downgrades Credit Ratings of Grange Life Insurance Company; Revises Issuer Credit Rating Outlook to Negative for Old American Insurance Company
- AM Best Affirms Credit Ratings of Bao Minh Insurance Corporation
- Prudential leads all life sellers as Q3 sales rise 3.2%, Wink reports
- AM Best Affirms Credit Ratings of Securian Financial Group, Inc. and Its Subsidiaries
More Life Insurance NewsProperty and Casualty News
- AM Best Affirms Credit Ratings of Selective Insurance Group, Inc. and Its Subsidiaries
- The Latest: Navy admiral who ordered attack that killed boat strike survivors briefs lawmakers
- ISG to Study Duck Creek Ecosystem Service Providers
- CI: CAN INSURANCE SAFEGUARD YOUR IDENTITY AND SUPPORT RECOVERY
- New Flood Insurance Rate Maps in Box Butte County
More Property and Casualty News