Life insurance applications up 3% in 2023; first rise in nearly 4 years

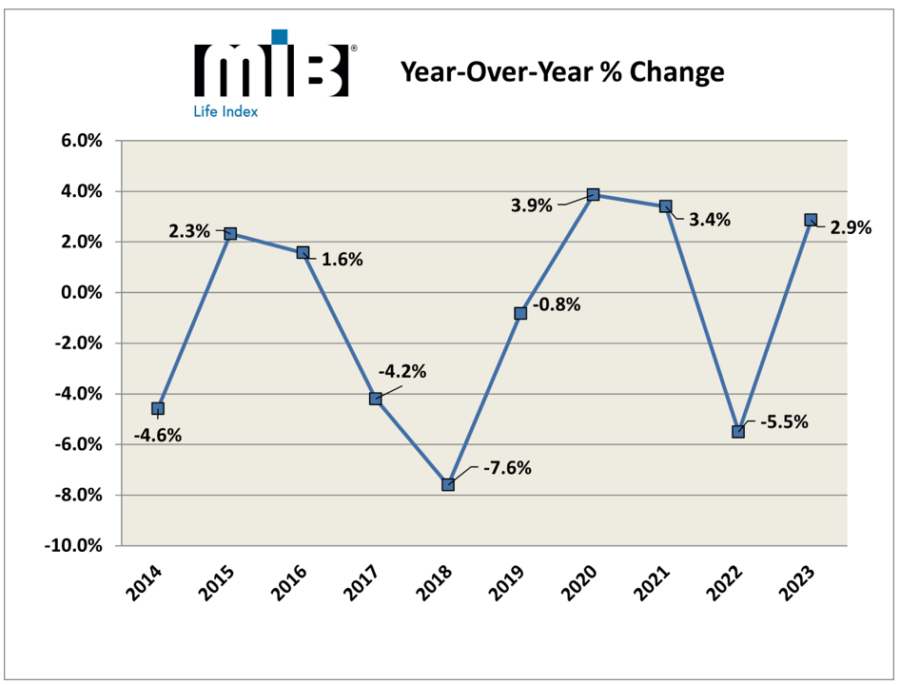
Application activity for U.S. life insurance grew at a near 3% rate in 2023 compared to the previous year showing the first uptick in almost four years, according to the MIB Group, a member-owned company that provides underwriting services to life and health insurance companies.
The 2023 year-to-year comparisons are impacted by the decline in 2022 applications. MIB reported that total activity last year was down 2.8% compared to 2021, flat compared to 2020, but up 4.4% compared to 2019.
“The year-over-year comparisons can fluctuate,” said Betty-Jean D. Lane, MIB’s head of marketing. “Of course, the COVID pandemic had an impact on 2020 results, which were record breaking. Further, the year-over-year decline in 2022 was not entirely unexpected, since it was in comparison to a very strong 2021, which had the second highest year-over-year growth in the last 10 years.”
Dec. life insurance applications up 6.5%
Applications in December 2023 were up 6.5%, compared to December 2022, representing the second highest year-over-year growth rate for the month of December on record, MIB said. Only September showed a decline in applications last year with all other months showing gains or flat activity.
“Growth in 2023 represents a reversal of patterns seen in 2022, where all months saw YOY declines or flat activity,” MIB said.
Insurers use MIB data as a guide to verify the information they receive on an application matches with other applications submitted over the past seven years. MIB’s data helps insurance companies identify possible errors, omissions, and misrepresentations on applications.

Growth drive by younger groups
The growth in 2023 was largely driven by younger age groups, MIB said, with application activity for ages 0-50 accelerating, while ages 51-70 saw declines, and ages 71+ saw flat activity.
During 2023, activity for ages:
- 0-30 was up +5.4% YTD in 2023
- 31-50 up +5.5%
- 51-60 down -1.9%
- 61-70 down -2.5%
- 71+ flat at +0.7%
“When examining monthly YOY growth by age band, we saw zigzagging patterns throughout 2023, most notably during Q4,” MIB’s report said.
All product types saw YTD growth in 2023 with Term Life up +2.0%, Universal Life up +6.9%, and Whole Life up +2.2%.
When breaking down activity by product type into age bands, term life saw YTD growth for ages 0-50, flat activity for ages 51-60, and double-digit declines for ages 61+.
Universal life saw double-digit YTD growth for ages 0-50, and flat activity for ages 51+.
Whole life saw YTD growth for ages 0-50 and ages 71+, declines for ages 51-60, and flat activity for ages 61-70.
“It is worth noting that ages 0-50 experienced year-to-date growth for all product types, in the double digits for Universal Life,” the report said.
MIB will publish its annual report later this month that should shed more insights into long-term trends, said Lane.
Doug Bailey is a journalist and freelance writer who lives outside of Boston. He can be reached at [email protected].
© Entire contents copyright 2024 by InsuranceNewsNet.com Inc. All rights reserved. No part of this article may be reprinted without the expressed written consent from InsuranceNewsNet.com.
Doug Bailey is a journalist and freelance writer who lives outside of Boston. He can be reached at [email protected].


Commentary: IRS must preserve microcaptive insurance
CMS proposal would make several changes to ACA health plans
Advisor News
- NAIFA: Financial professionals are essential to the success of Trump Accounts
- Changes, personalization impacting retirement plans for 2026
- Study asks: How do different generations approach retirement?
- LTC: A critical component of retirement planning
- Middle-class households face worsening cost pressures
More Advisor NewsAnnuity News
- Trademark Application for “INSPIRING YOUR FINANCIAL FUTURE” Filed by Great-West Life & Annuity Insurance Company: Great-West Life & Annuity Insurance Company
- Jackson Financial ramps up reinsurance strategy to grow annuity sales
- Insurer to cut dozens of jobs after making splashy CT relocation
- AM Best Comments on Credit Ratings of Teachers Insurance and Annuity Association of America Following Agreement to Acquire Schroders, plc.
- Crypto meets annuities: what to know about bitcoin-linked FIAs
More Annuity NewsHealth/Employee Benefits News
- Arizona ACA enrollment plummets by 66,000 as premium tax credits expire
- HOW A STRONG HEALTH PLAN CAN LEAD TO HIGHER EMPLOYEE RETENTION
- KFF HEALTH NEWS: RED AND BLUE STATES ALIKE WANT TO LIMIT AI IN INSURANCE. TRUMP WANTS TO LIMIT THE STATES.
- THE DIFFERENCE INTEGRATION MAKES IN CARE FOR DUAL ELIGIBLES
- Arkansas now the only state in the country to withhold Medicaid from new moms
More Health/Employee Benefits NewsLife Insurance News